Peri-urban plan priority areas map
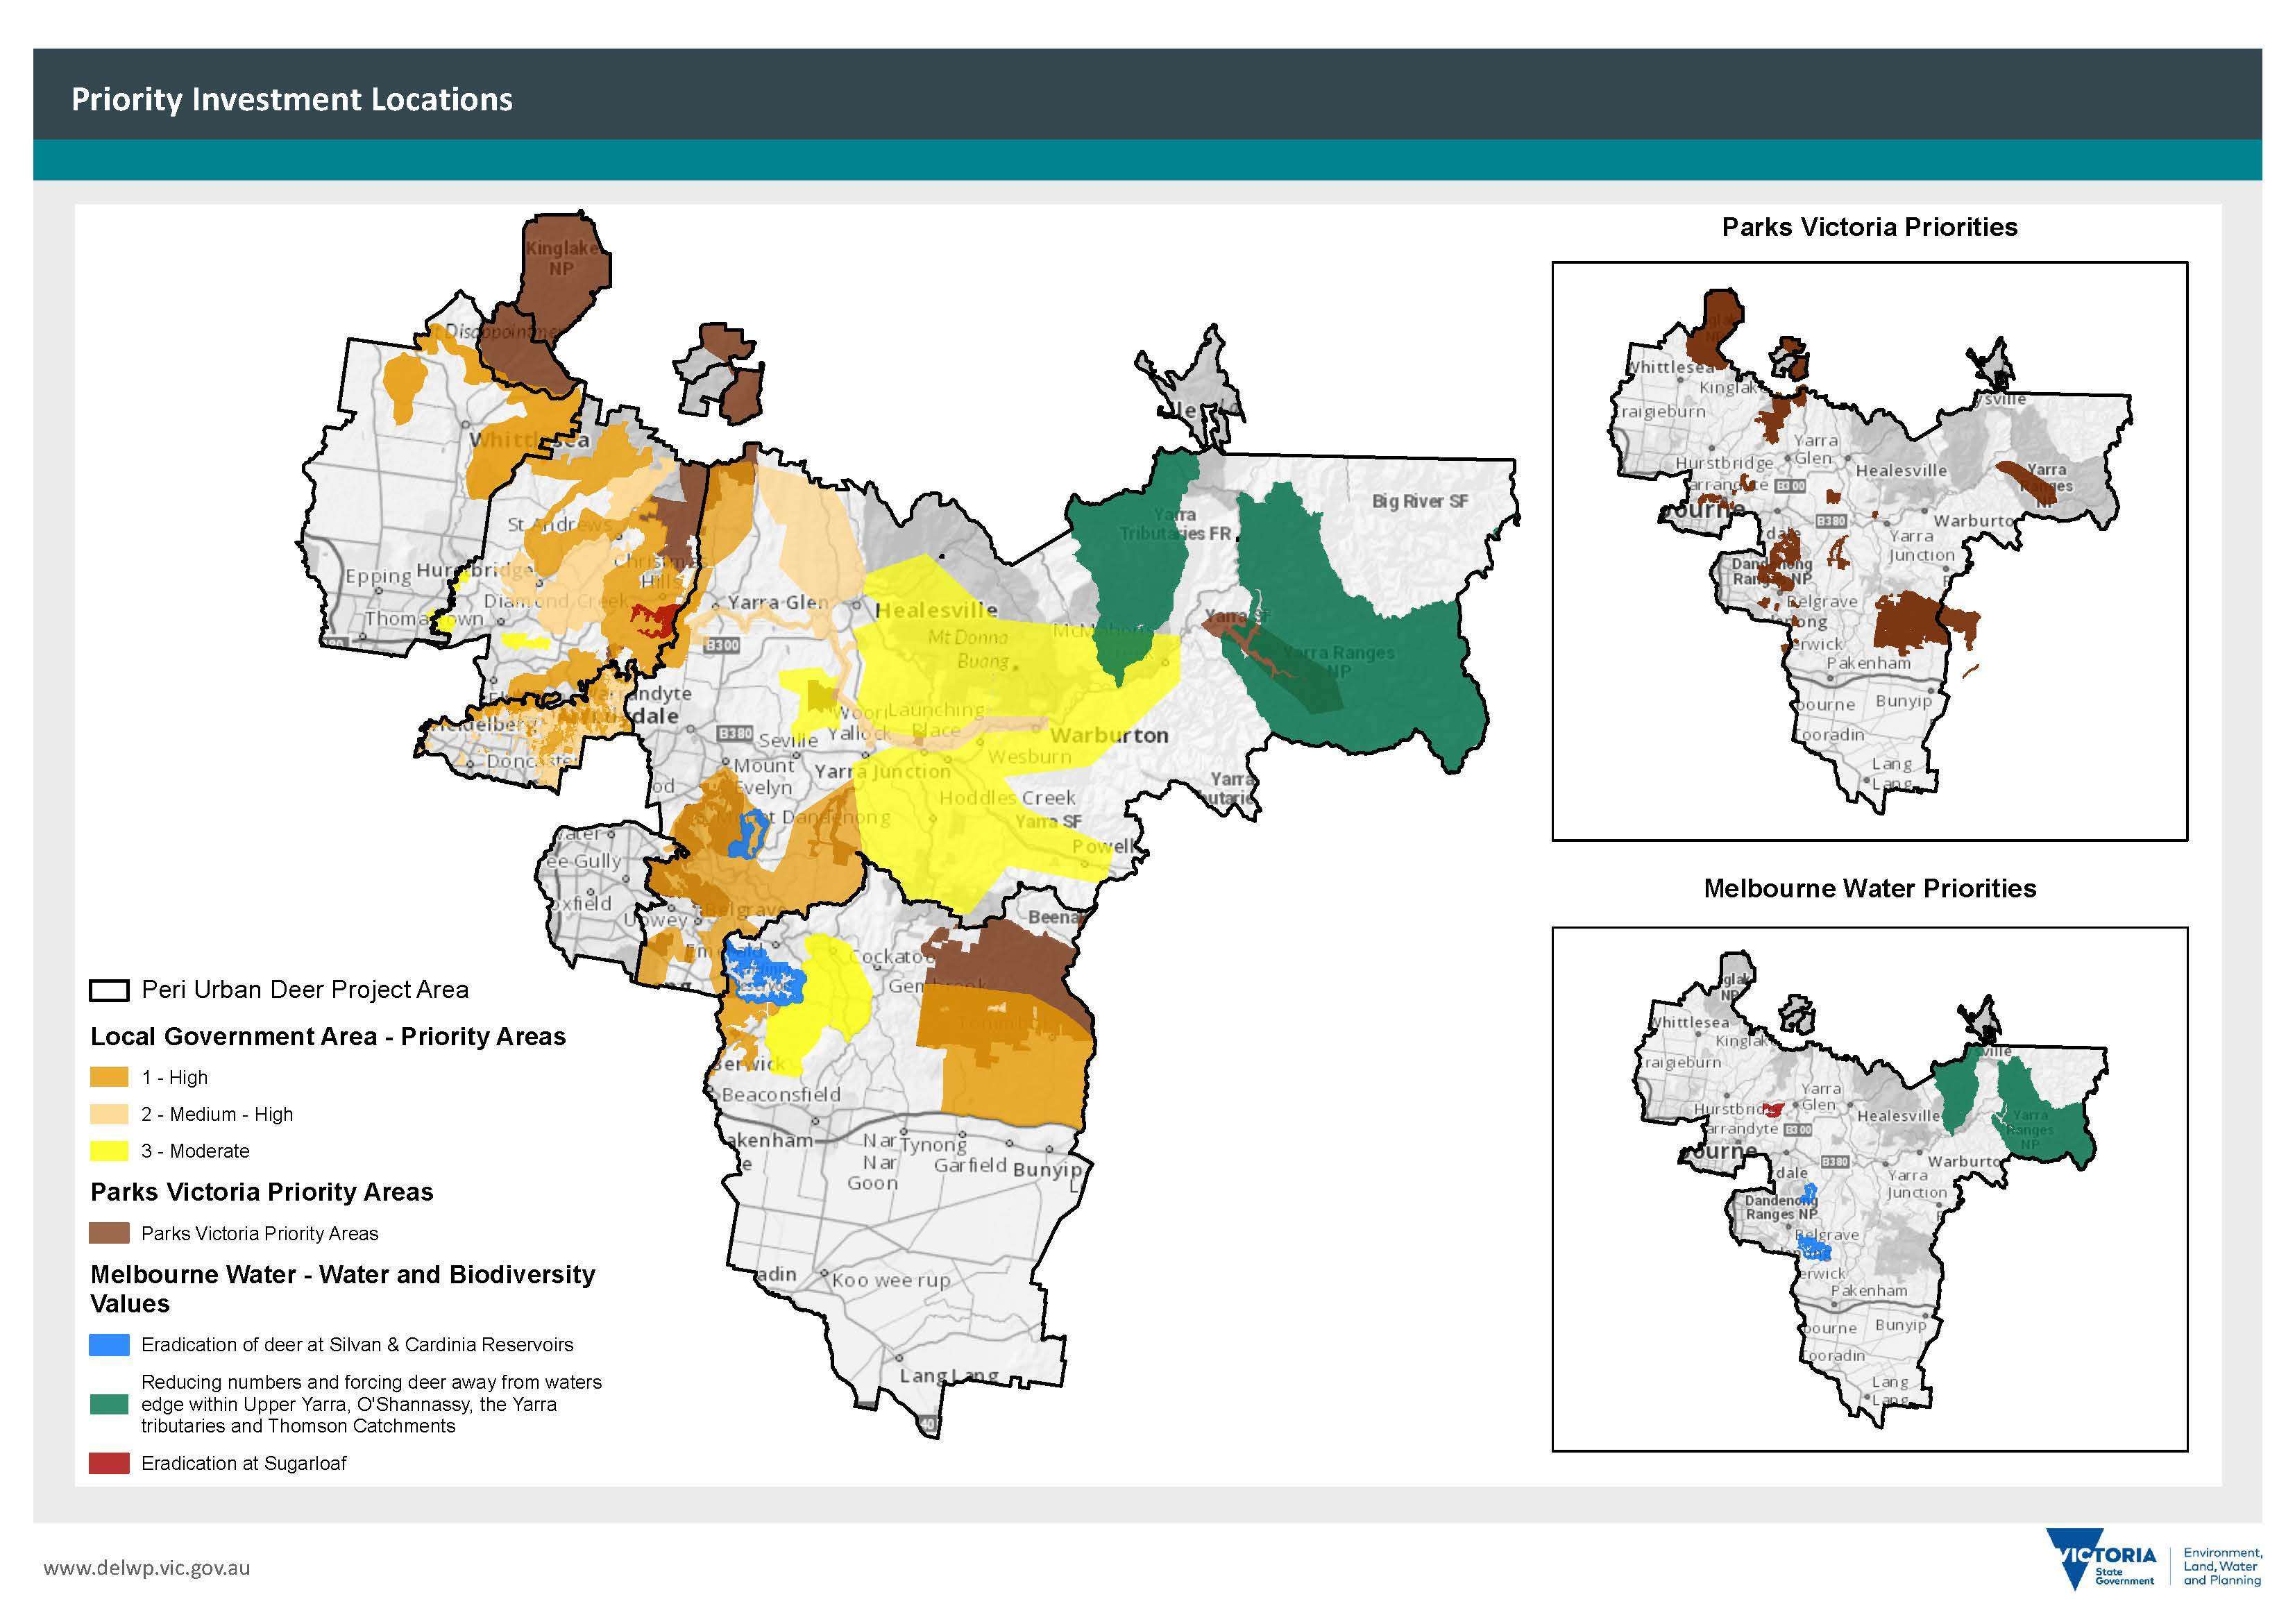
Figure 1 and figure 2 shows how the different maps and spatial tools were used in Nillumbik Shire LGA to identify priority areas.
Development of Priority Areas Maps
 To develop the priority area maps, the Peri-urban partnership group members from Local Government Areas (LGAs) and community liaised with their local environment and Landcare groups to collate information on local biodiversity values, known deer threats and locations of local deer control and management efforts. This information was mapped and overlaid with other spatial datasets of deer distribution, biodiversity, other threats and values, and where there were multiple overlapping mapped areas of values and threats, these were identified as key focus areas for prioritisation of control works, fencing and monitoring.
Public land managers undertook similar assessments of their own assets, focussing on biodiversity and water values, the current levels of deer impact and threat, and other organisational values and management capabilities and approaches.
The analysis undertaken utilised mapping from the Strategic Management Prospects (SMP) Version 2. Version 3 has now been released and utilised in relevant maps shown below.
As new information becomes available, priority site maps will be updated. The Partnership Group will undertake a review of priority sites at least once per year, to update locations and reflect on changes in their suitability. Actions for improvement in mapping have been identified within the Peri-urban Deer Control Plan, and the overarching Strategy, such as the collection of deer-vehicle collision data. Other datasets will also be added to, in the knowledge that more accurate mapping will improve the ability to identify priority areas in addition to those mapped in SMP.
Priority maps, including the underlying spatial layers of current and planned works, can be used to initiate a discussion between partnership group members. The mapping:
- allows for gap analysis to be undertaken, such as where risks have been identified, but no works are planned or underway,
- provides opportunities for improved collaboration across LGAs and between private landholders and public land agencies, as adjoining projects are more easily identified, allowing for complementary projects to be combined for greater efficiency and cost-effectiveness.
Example: Mapping Nillumbik Shire Council priority areas
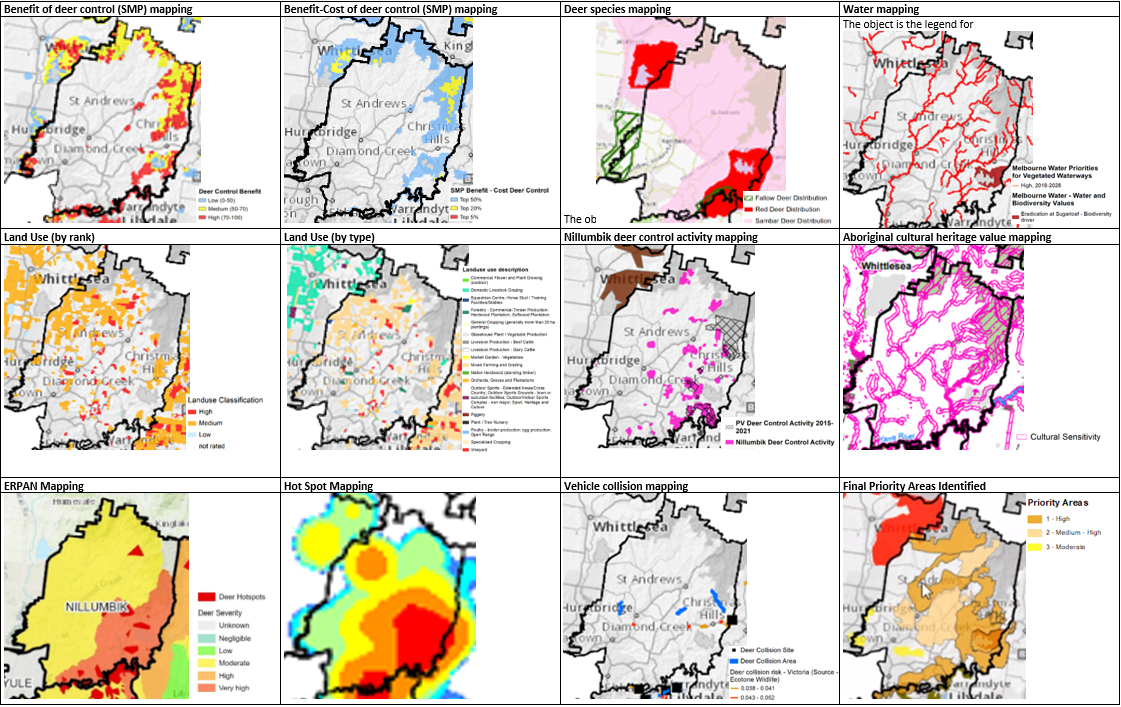
Figure 2: Mapping slices used to identify Nillumbik Shire LGA priority areas
Peri-Urban Plan Area
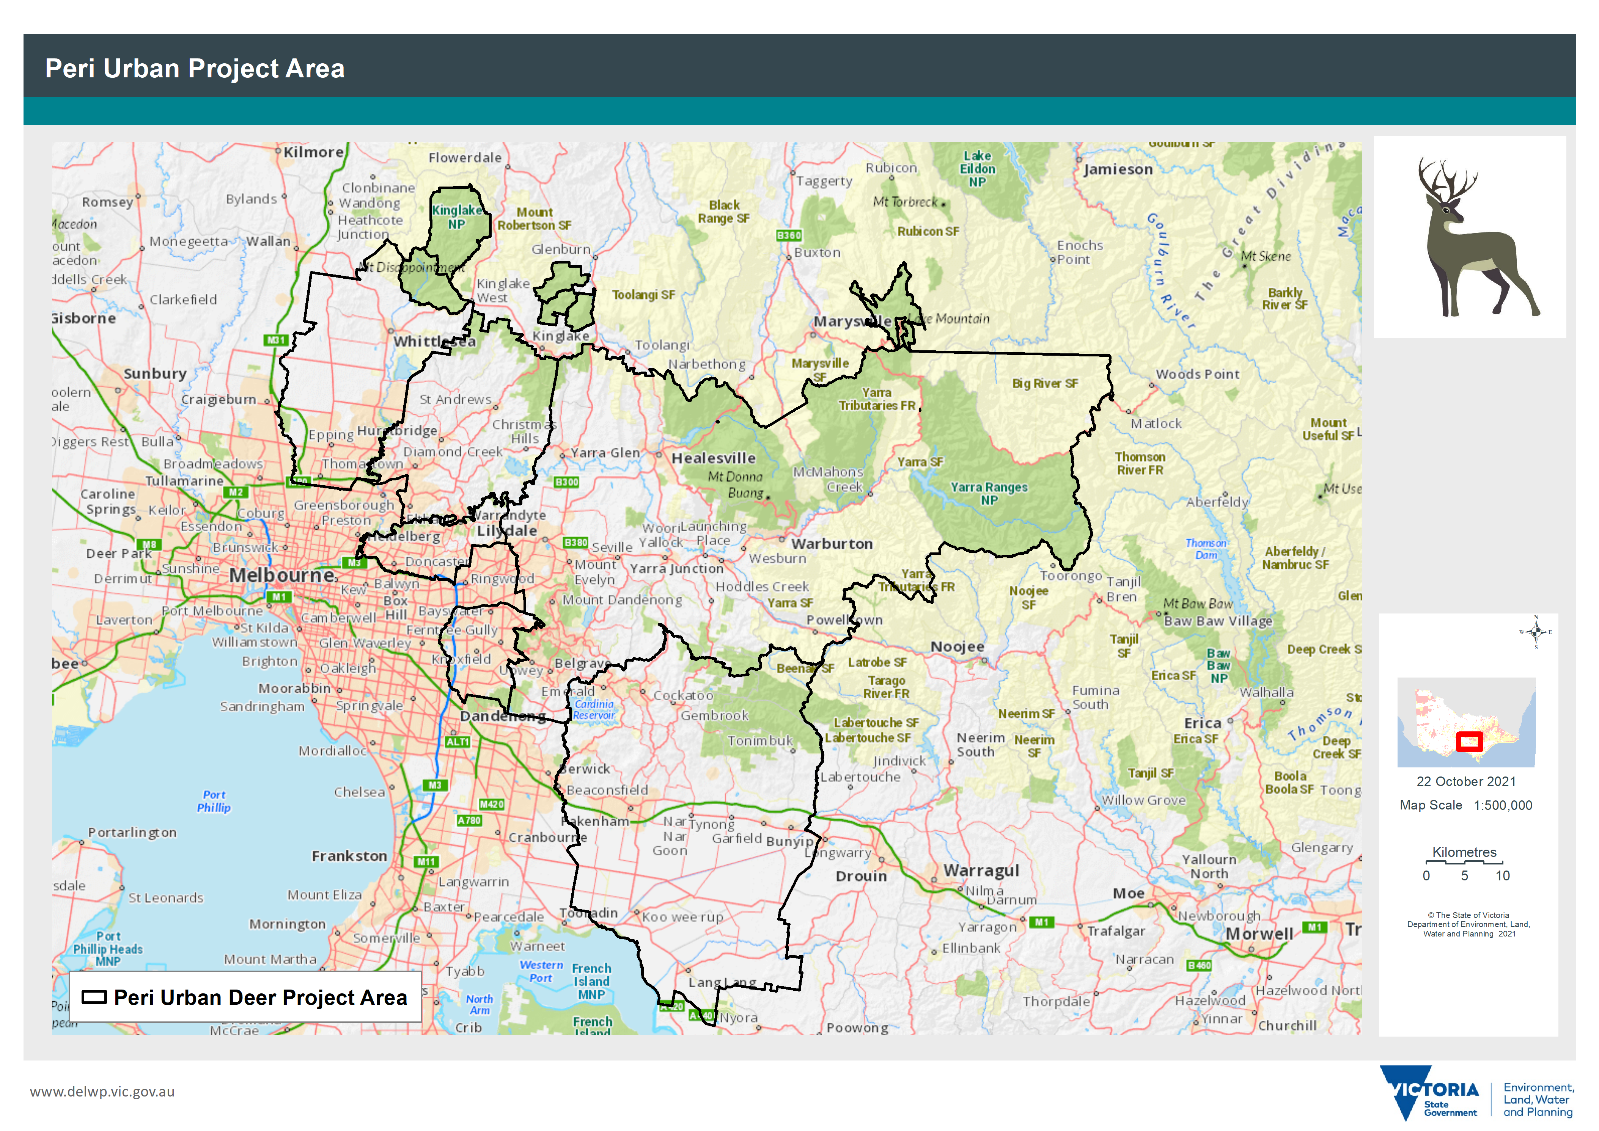
Figure 3: Peri-urban plan area
Local Government Area Maps
Nillumbik Shire Council priority areas
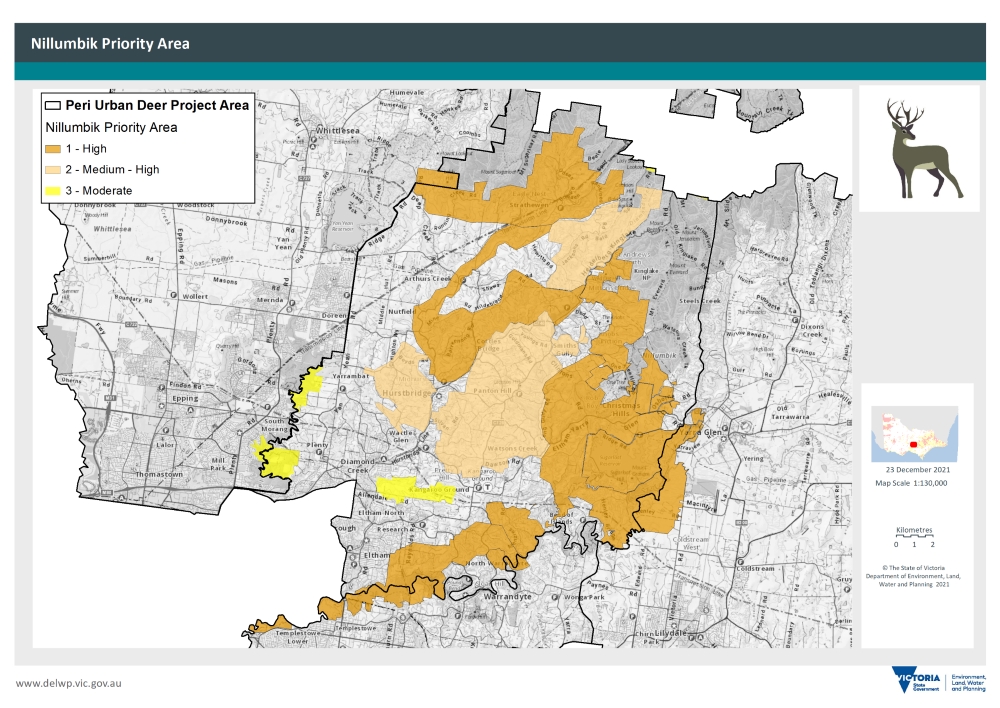
Figure 4: Nillumbik Shire LGA priority areas for deer control
Yarra Ranges Council priority areas
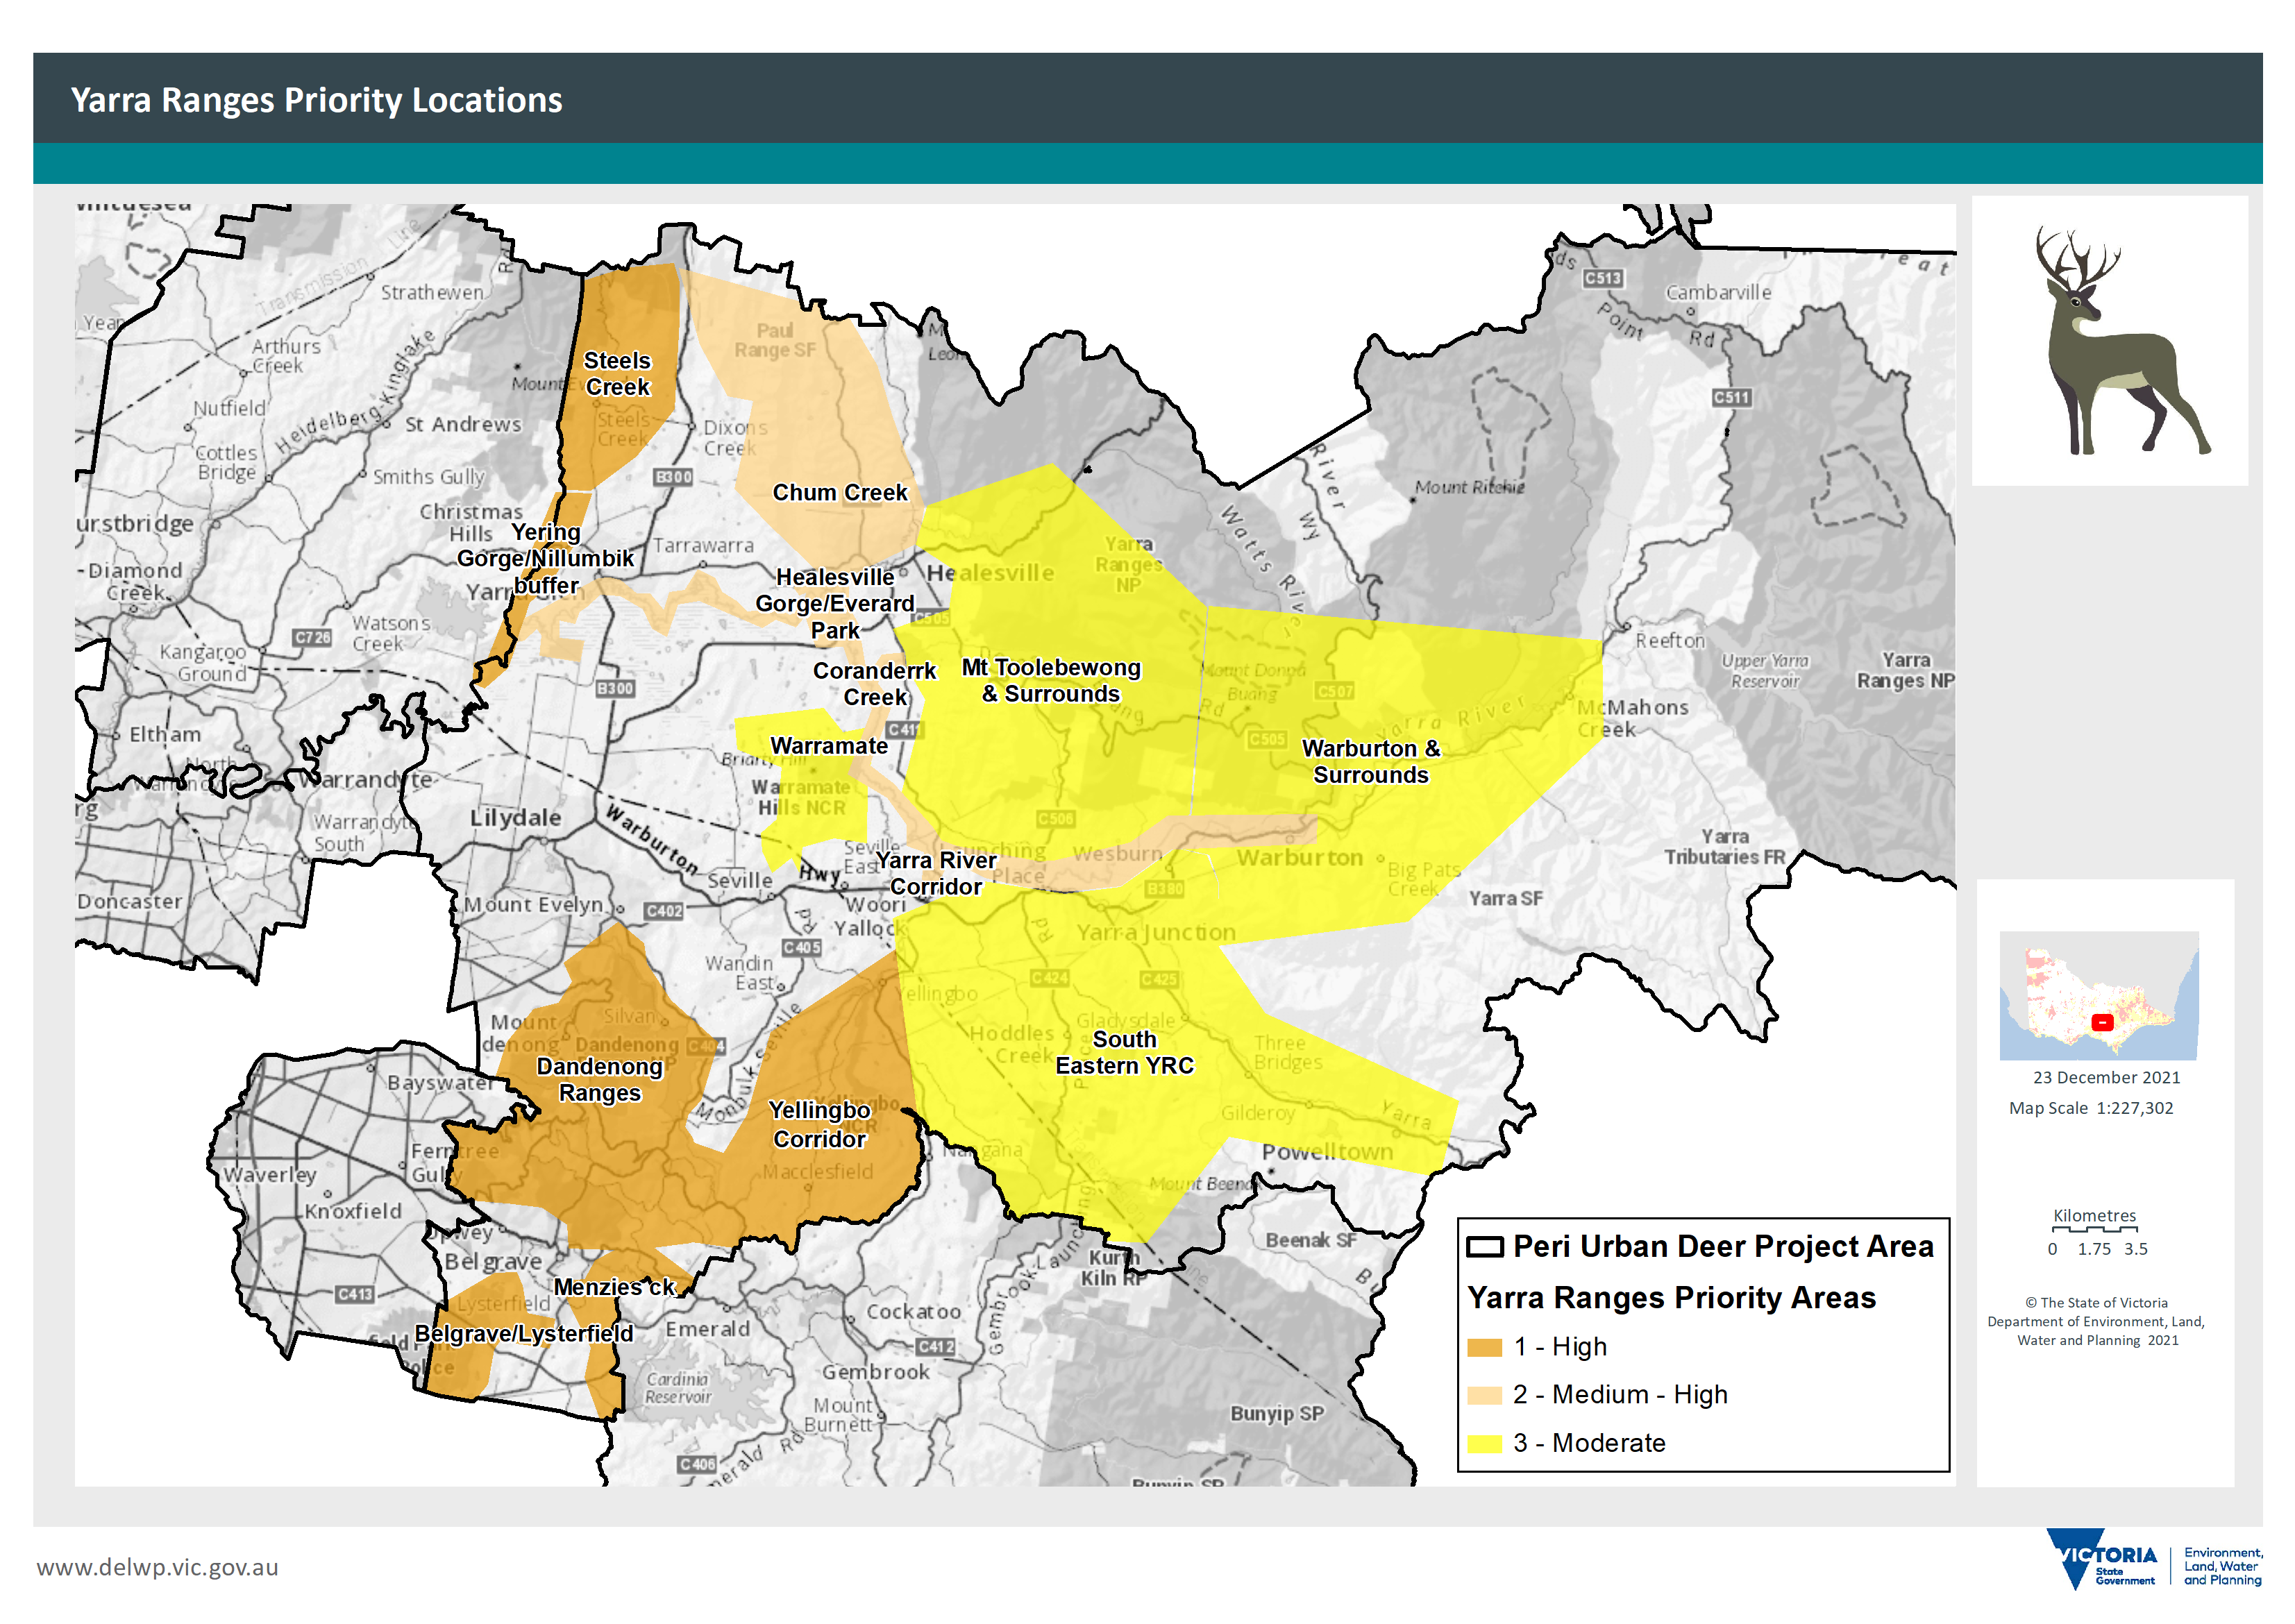
Figure 5: Yarra Ranges LGA priority areas for deer control
Cardinia Shire Council priority areas
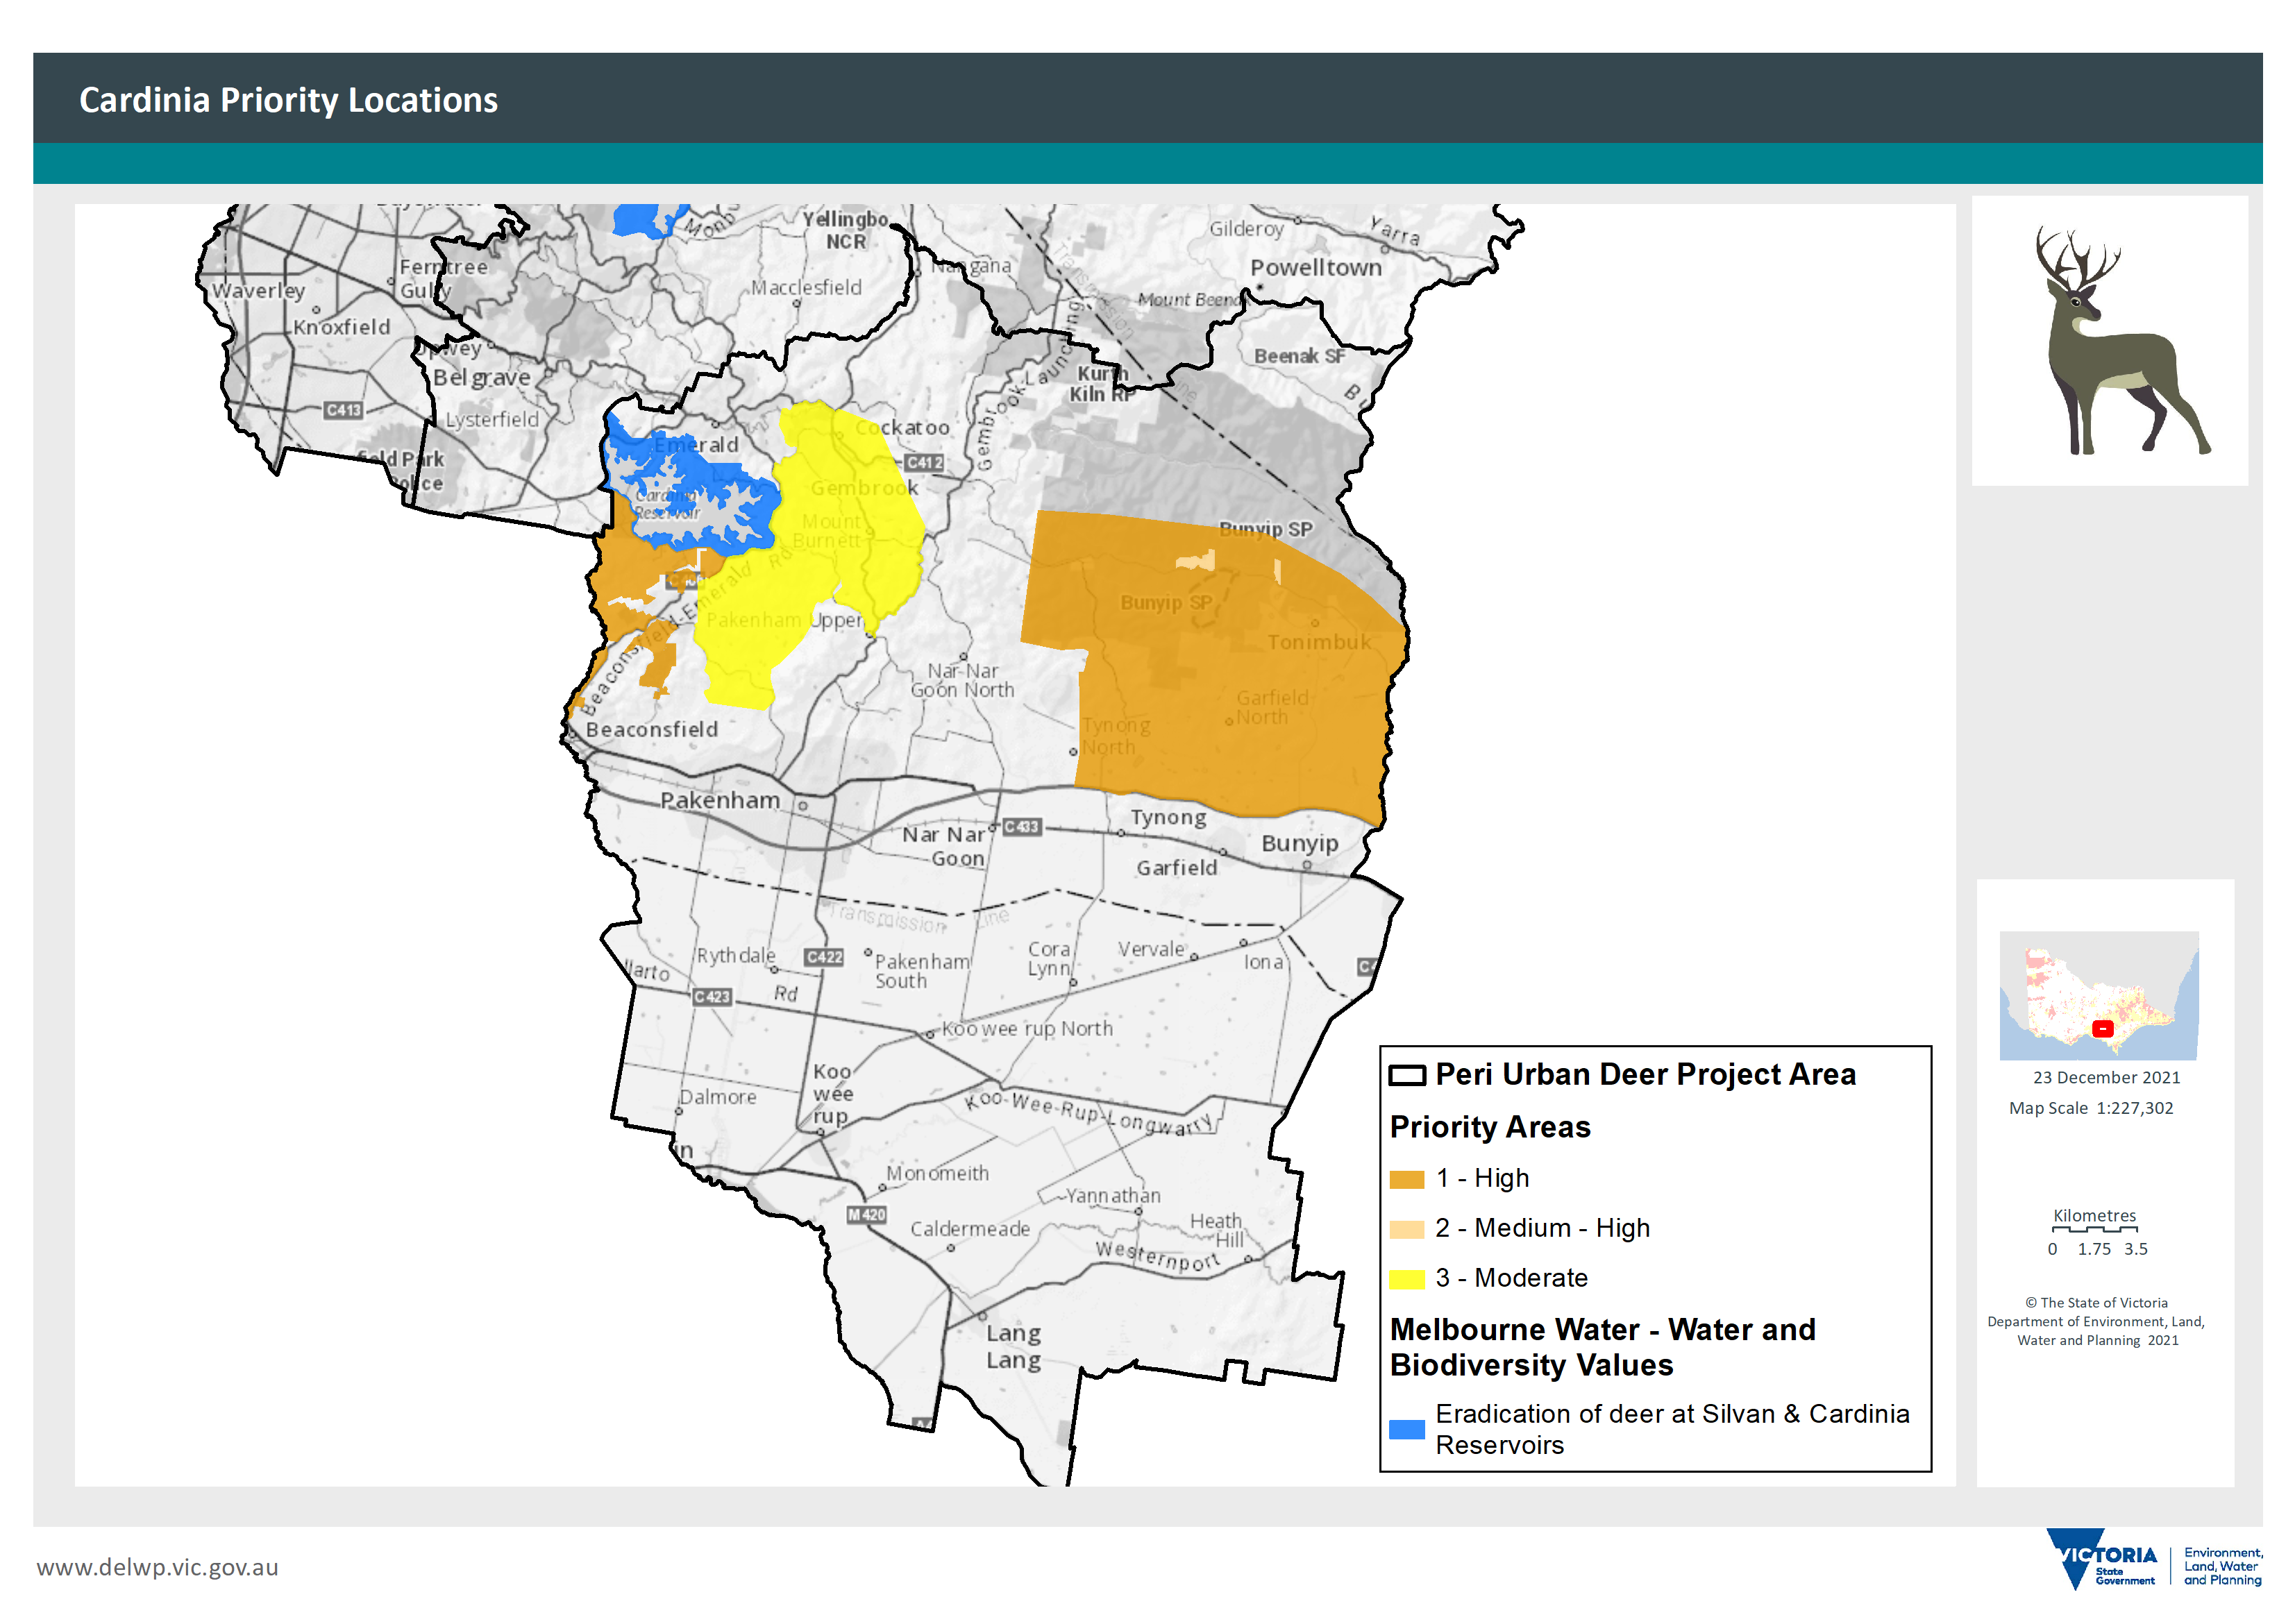
Figure 6: Cardinia LGA priority areas for deer control
Knox City Council priority areas
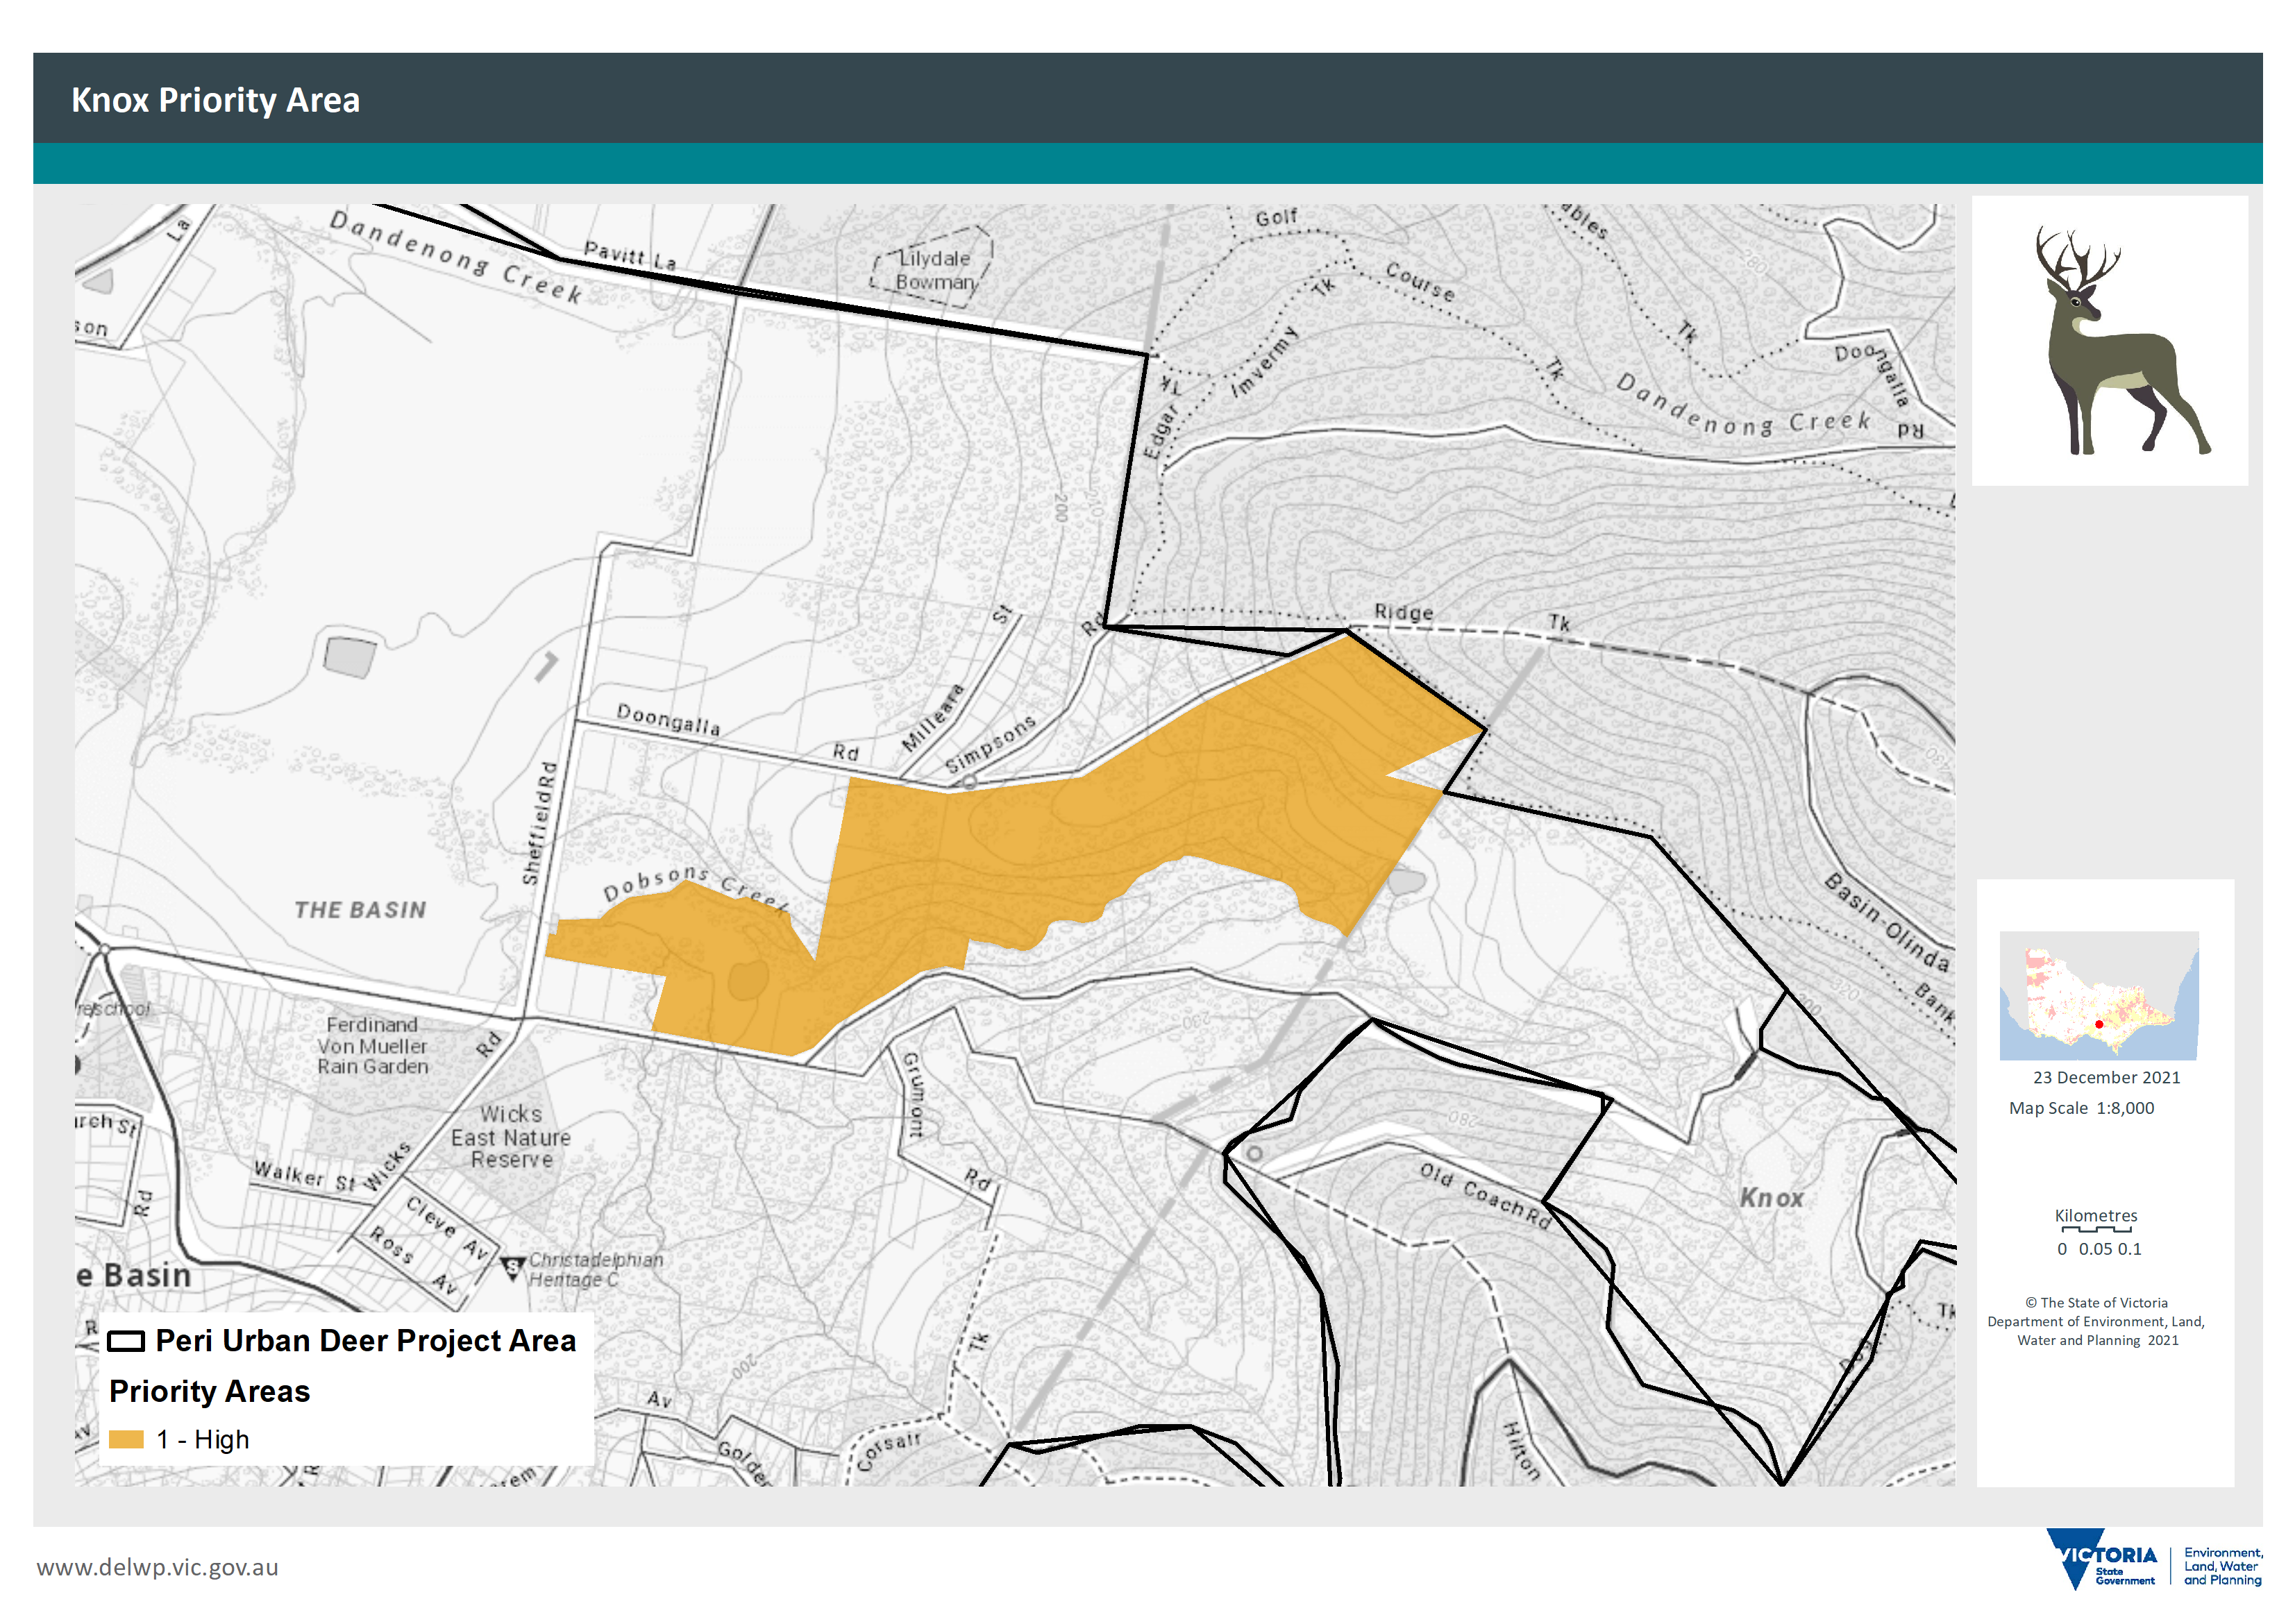
Figure 7: Knox City Council priority areas for deer control
Manningham City Council priority areas
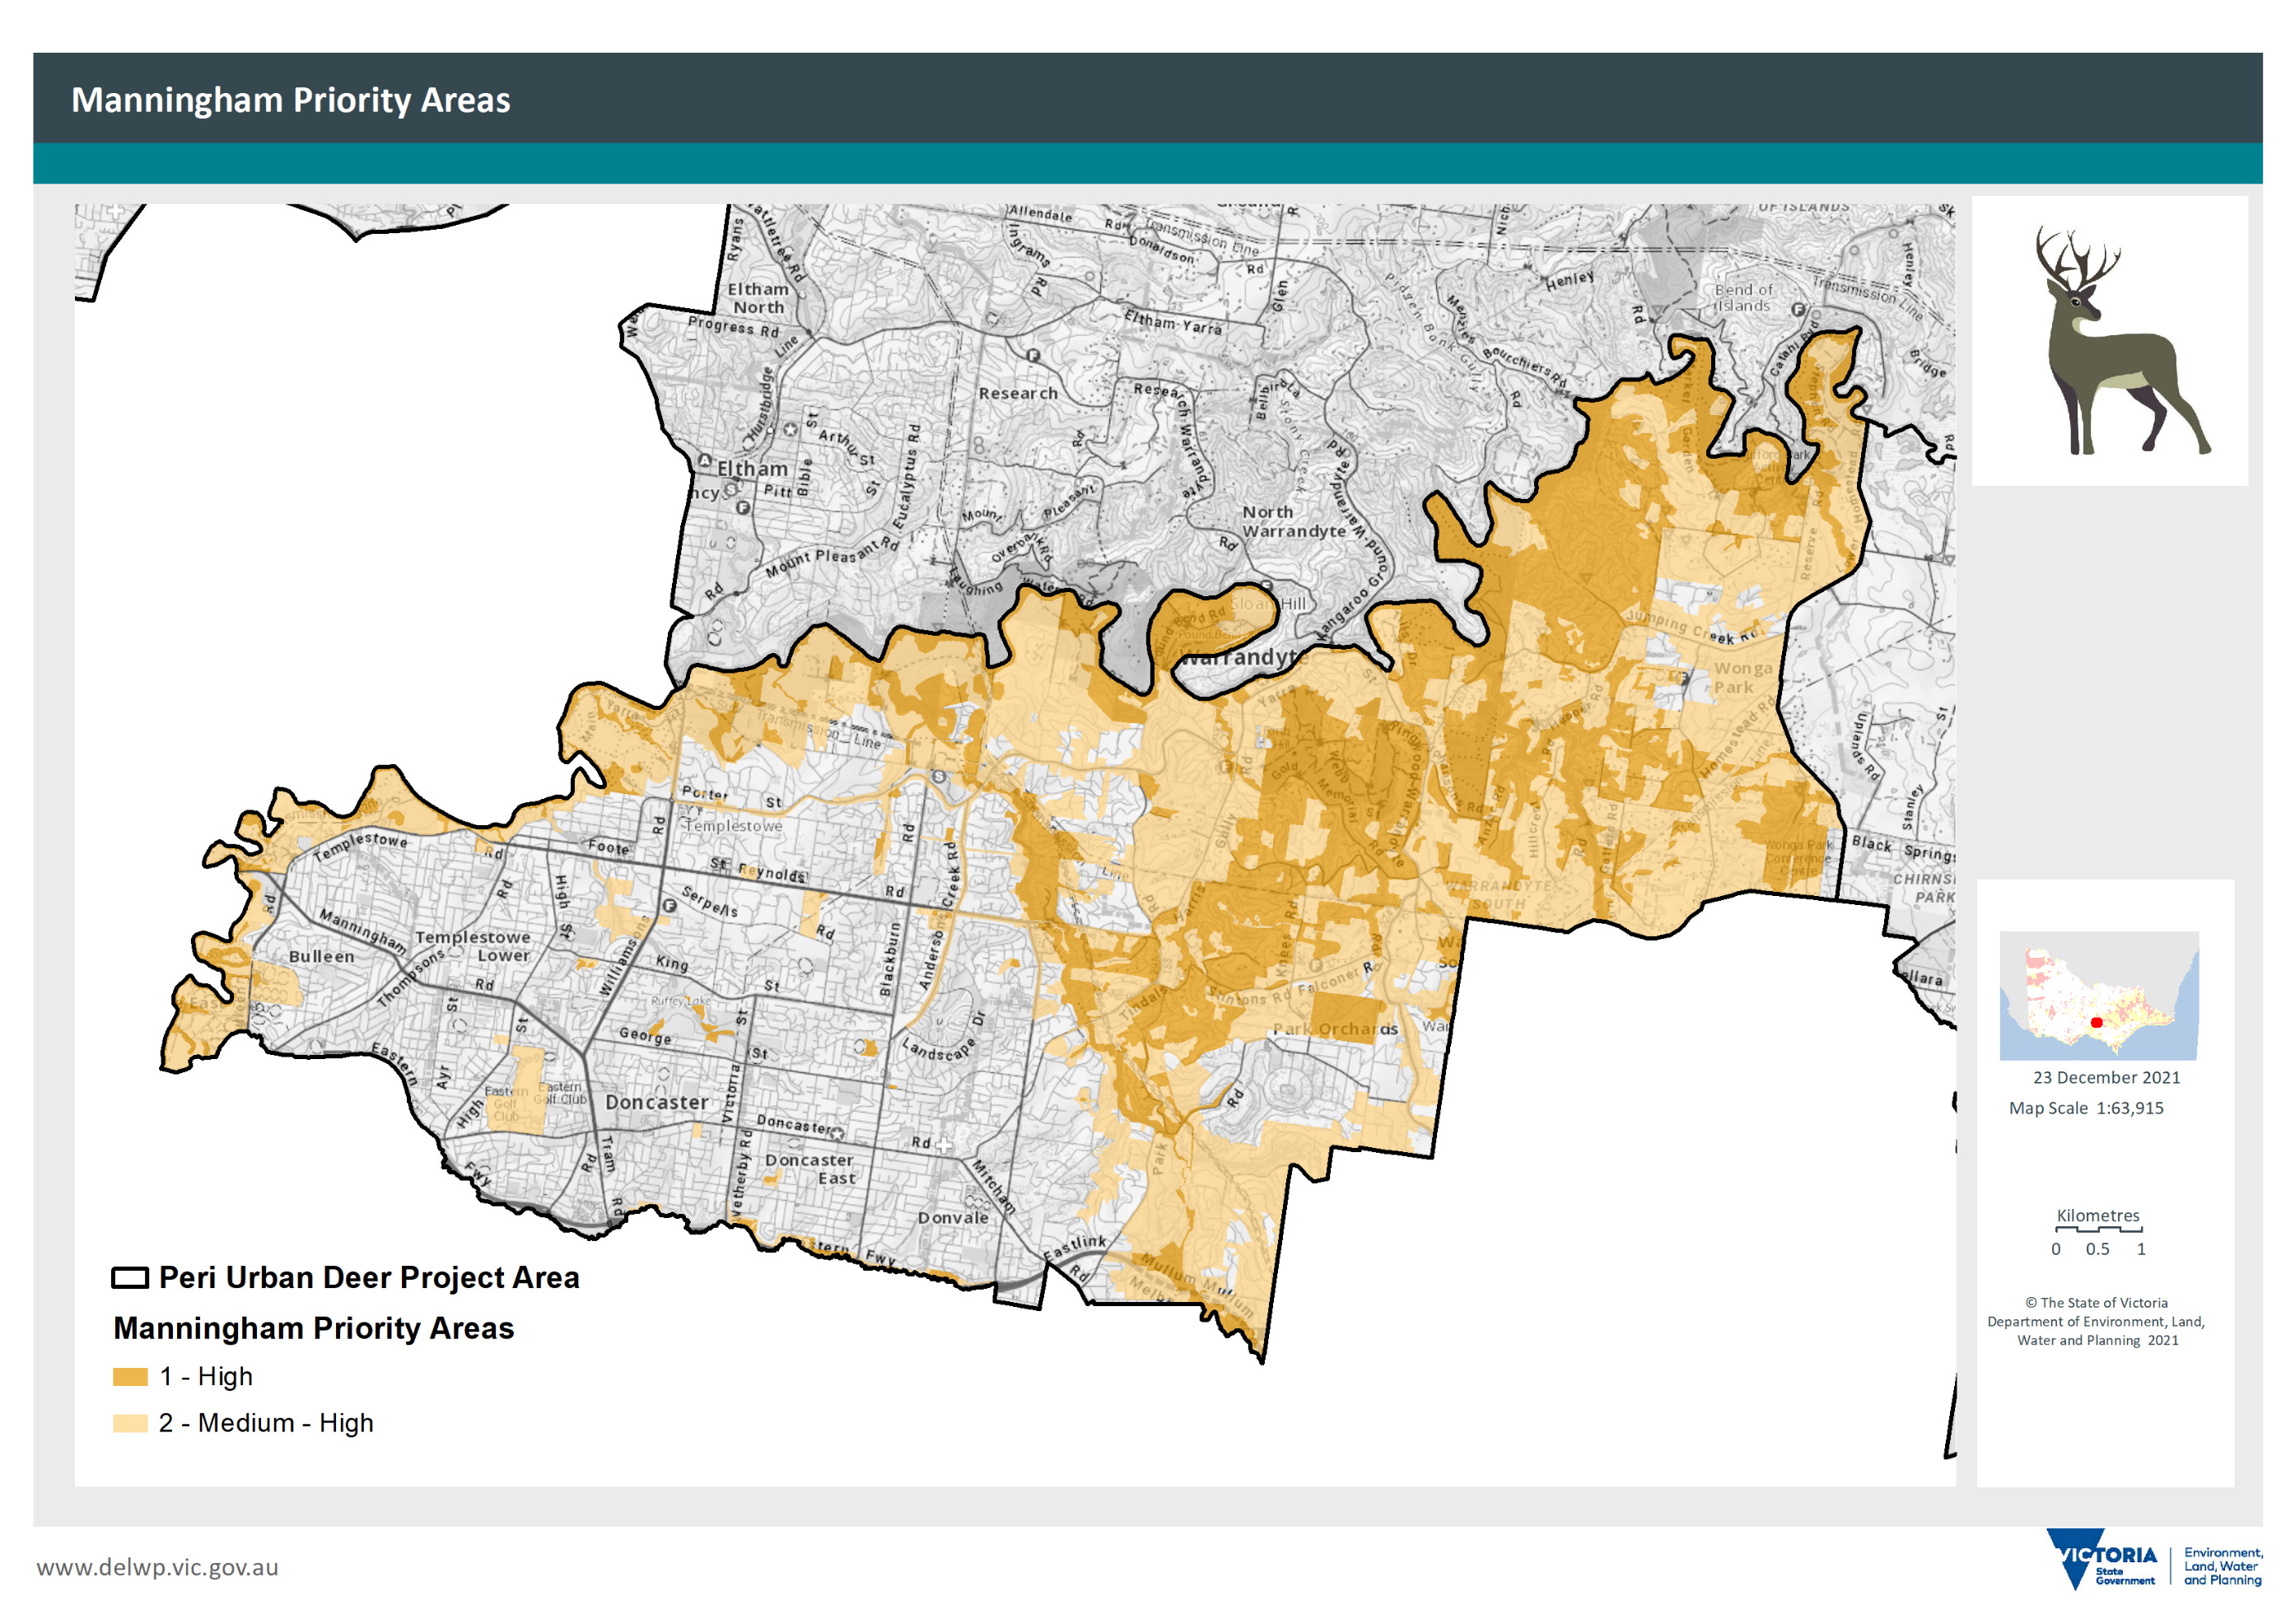
Figure 8: Manningham City Council priority areas for deer control
Additional agricultural land use details for Manningham City LGA
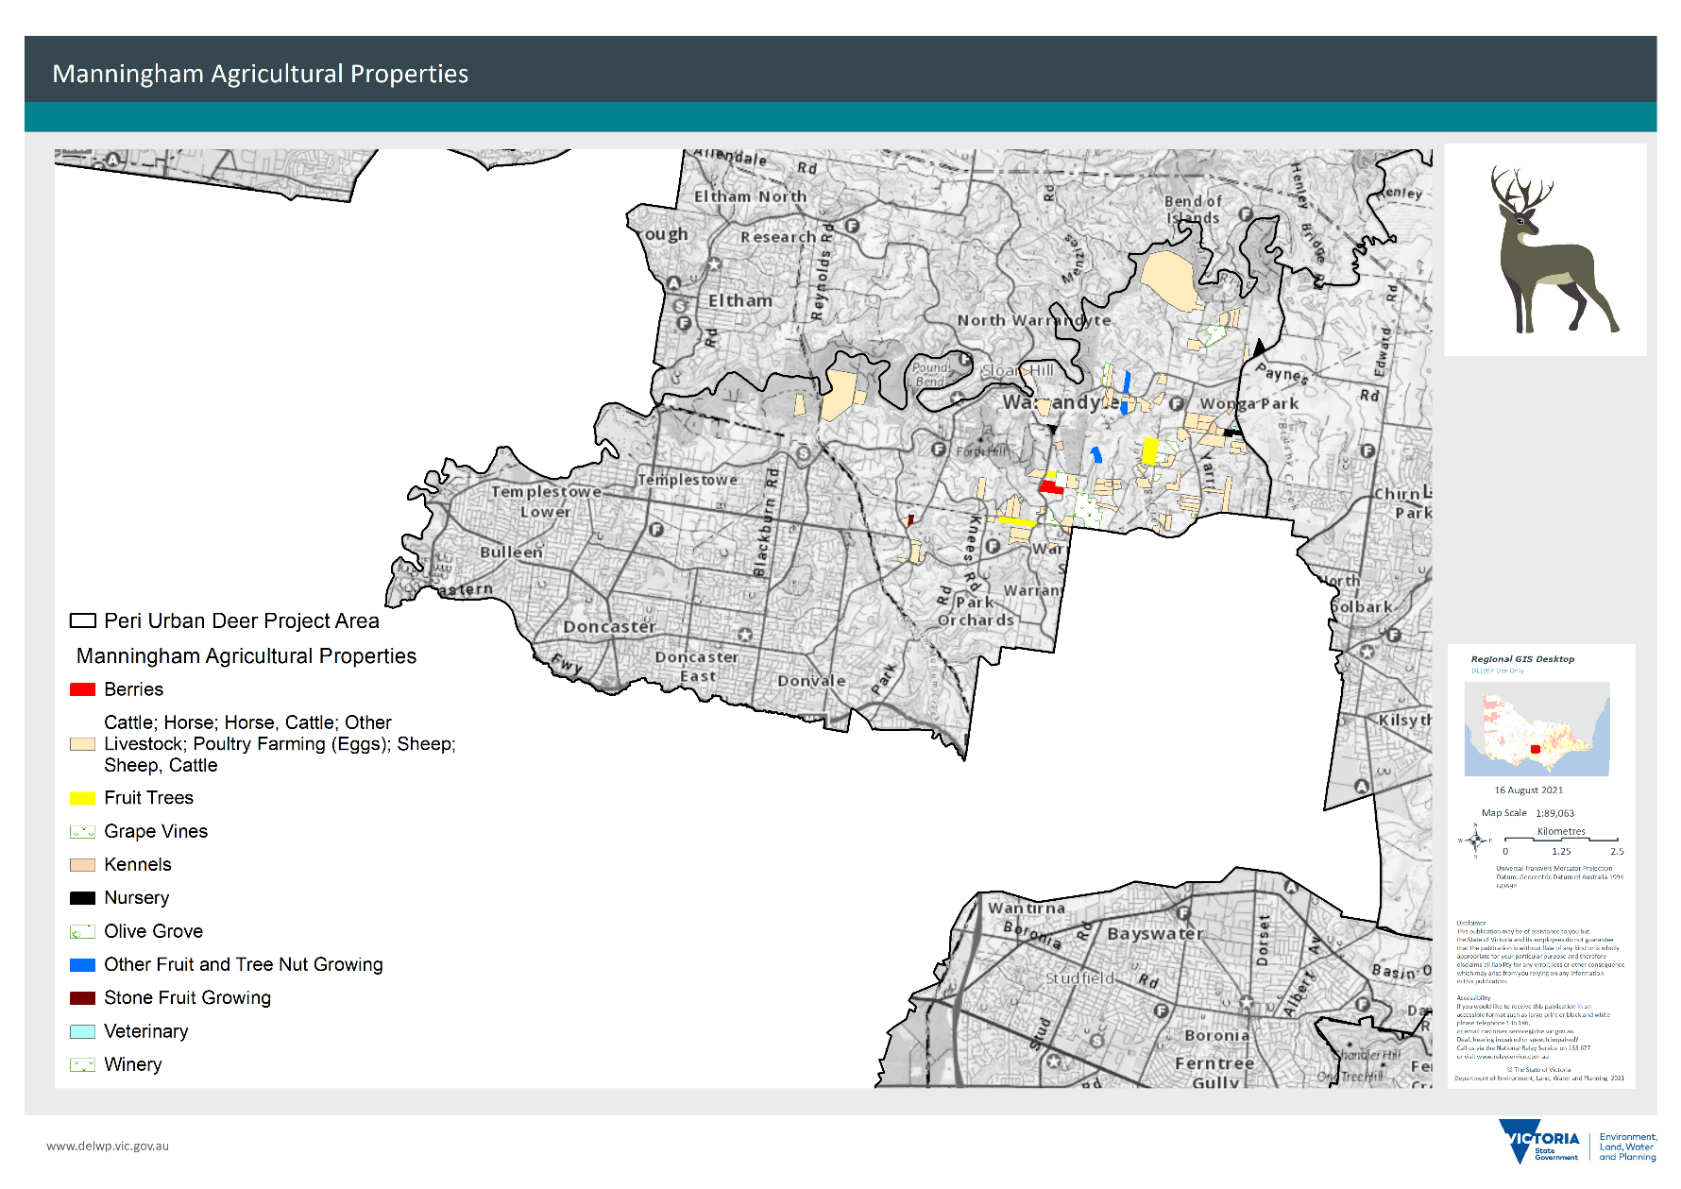
Figure 9: Land use in Manningham City LGA
Stock locations in Manningham City LGA
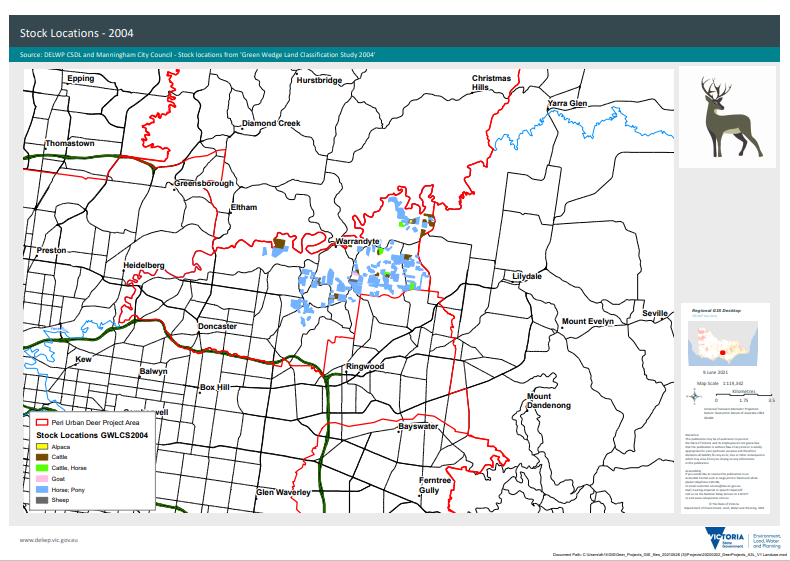
Figure 10: Locations of stock in Manningham City LGA
City of Whittlesea Council priority areas
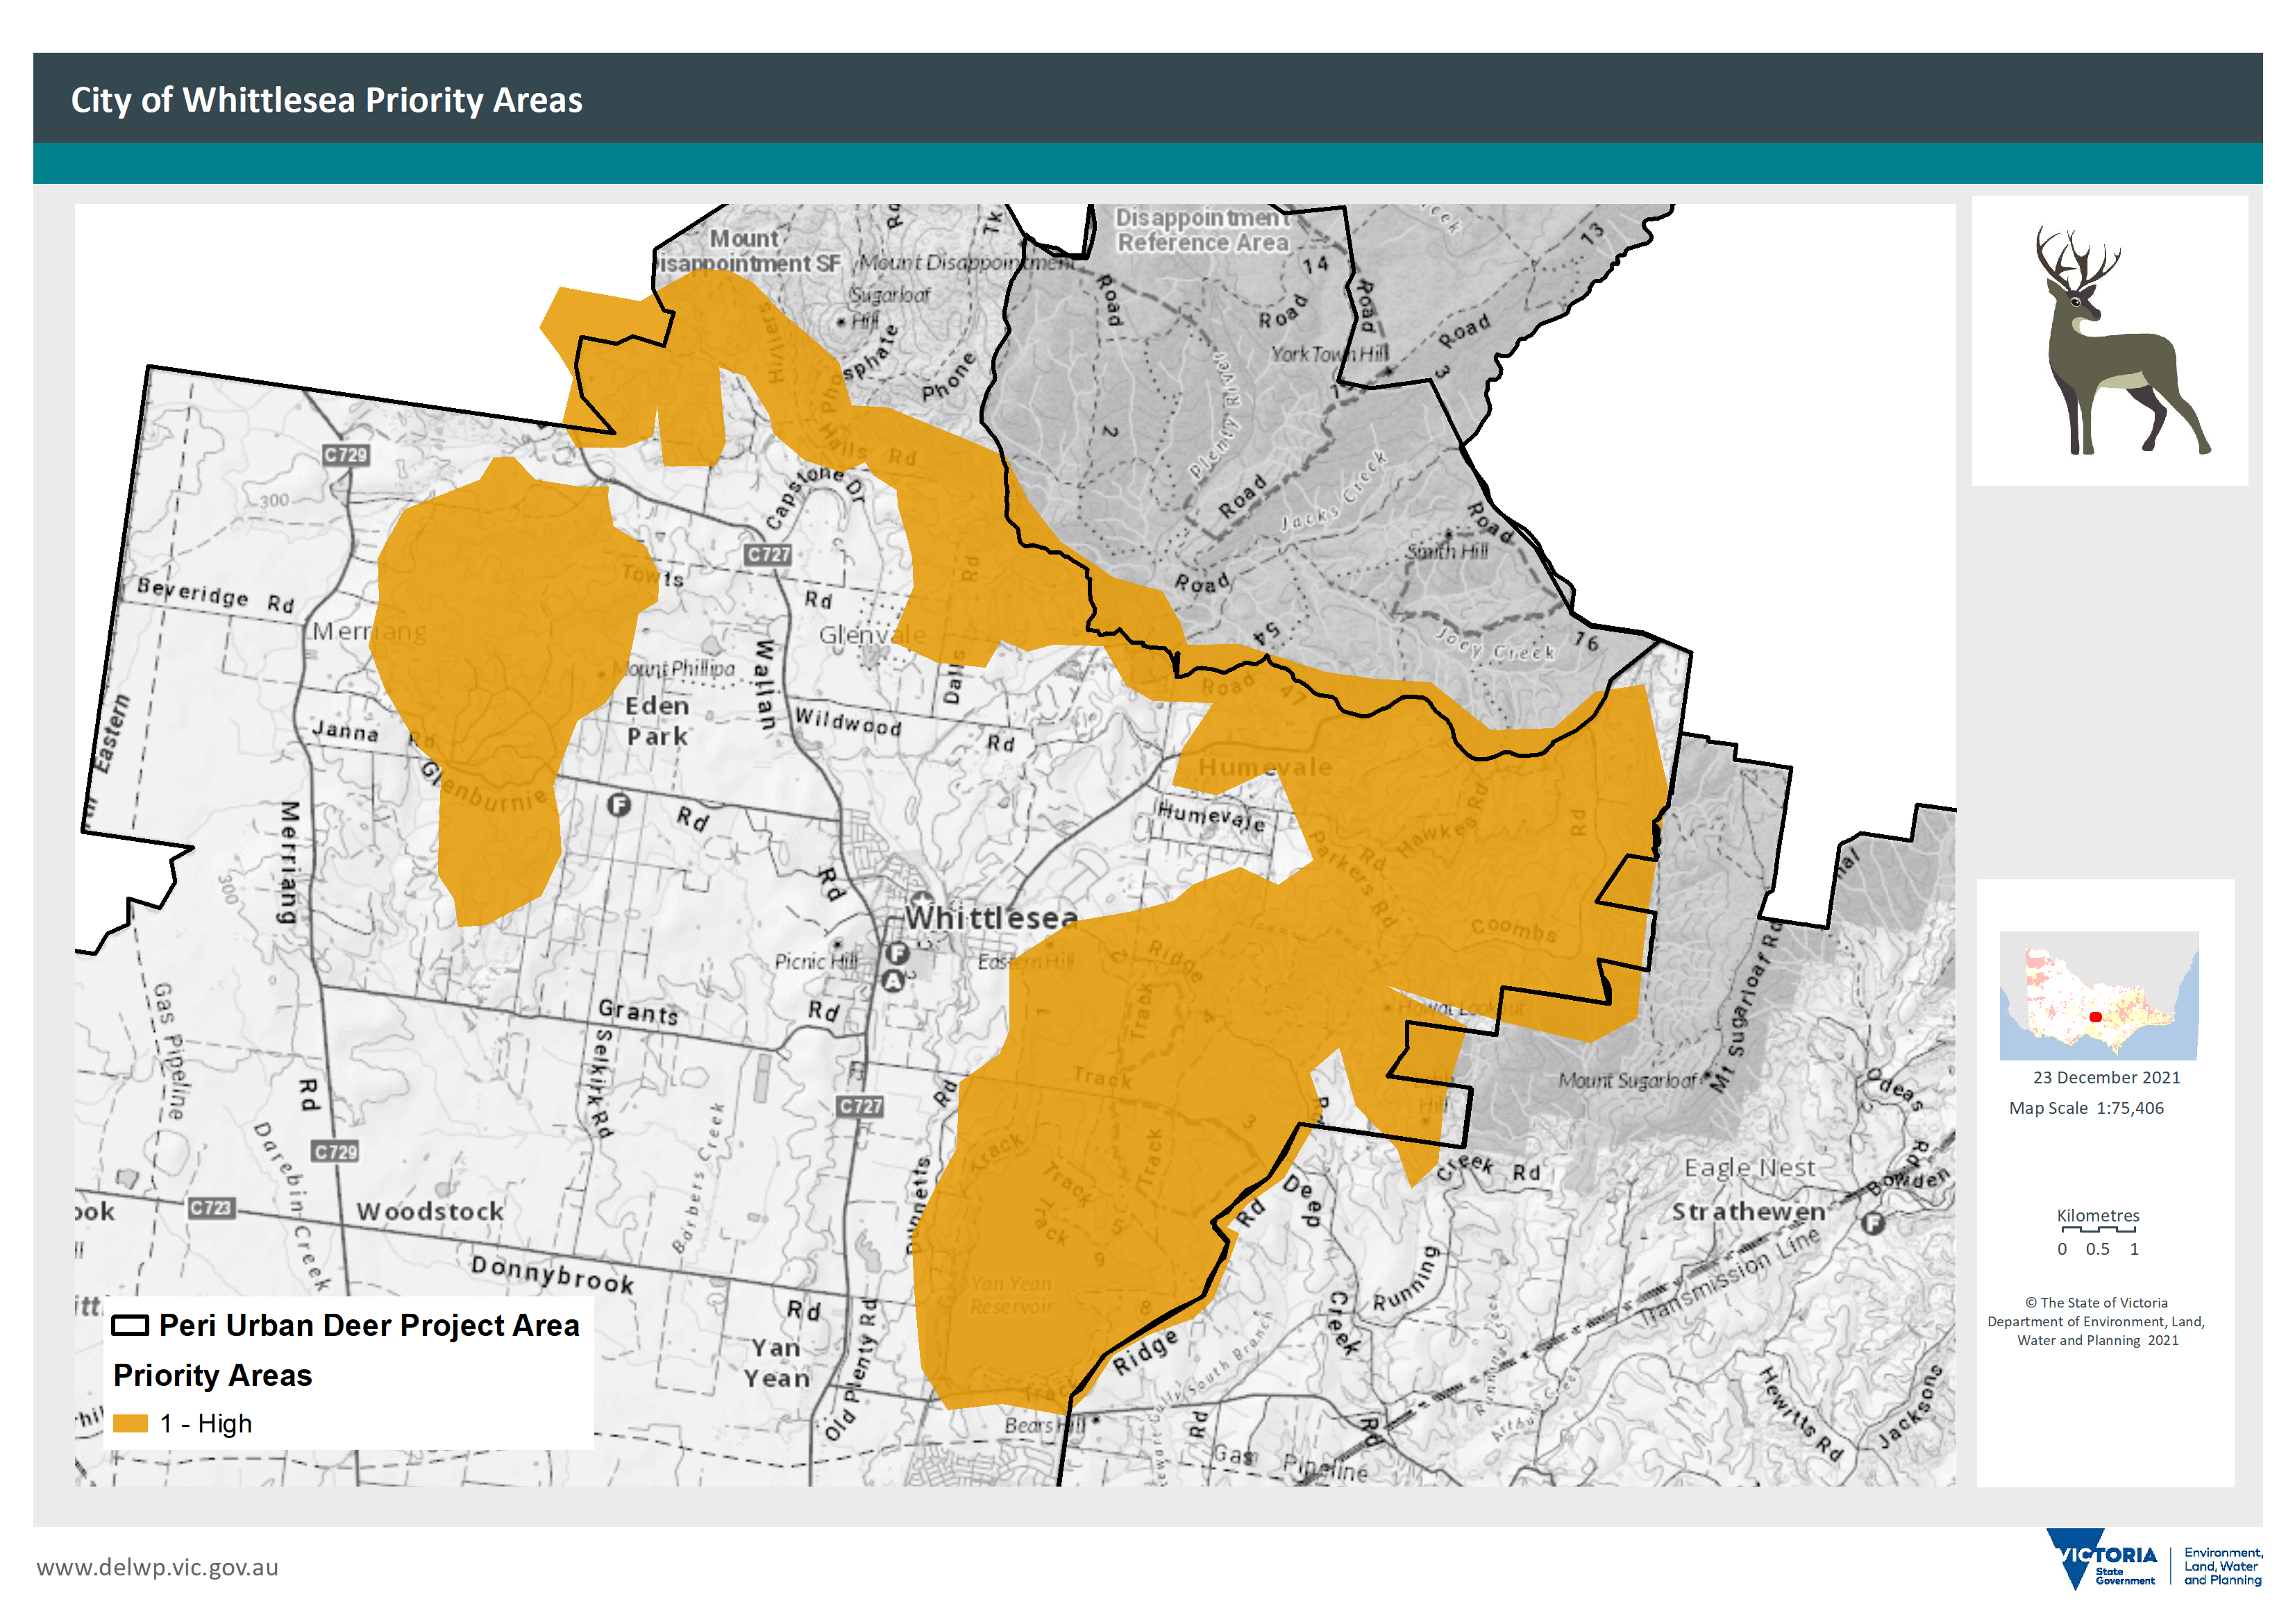
Figure 11: City of Whittlesea area priority areas for deer control
Melbourne Water Riparian and Water Catchment Values across the Peri-Urban area
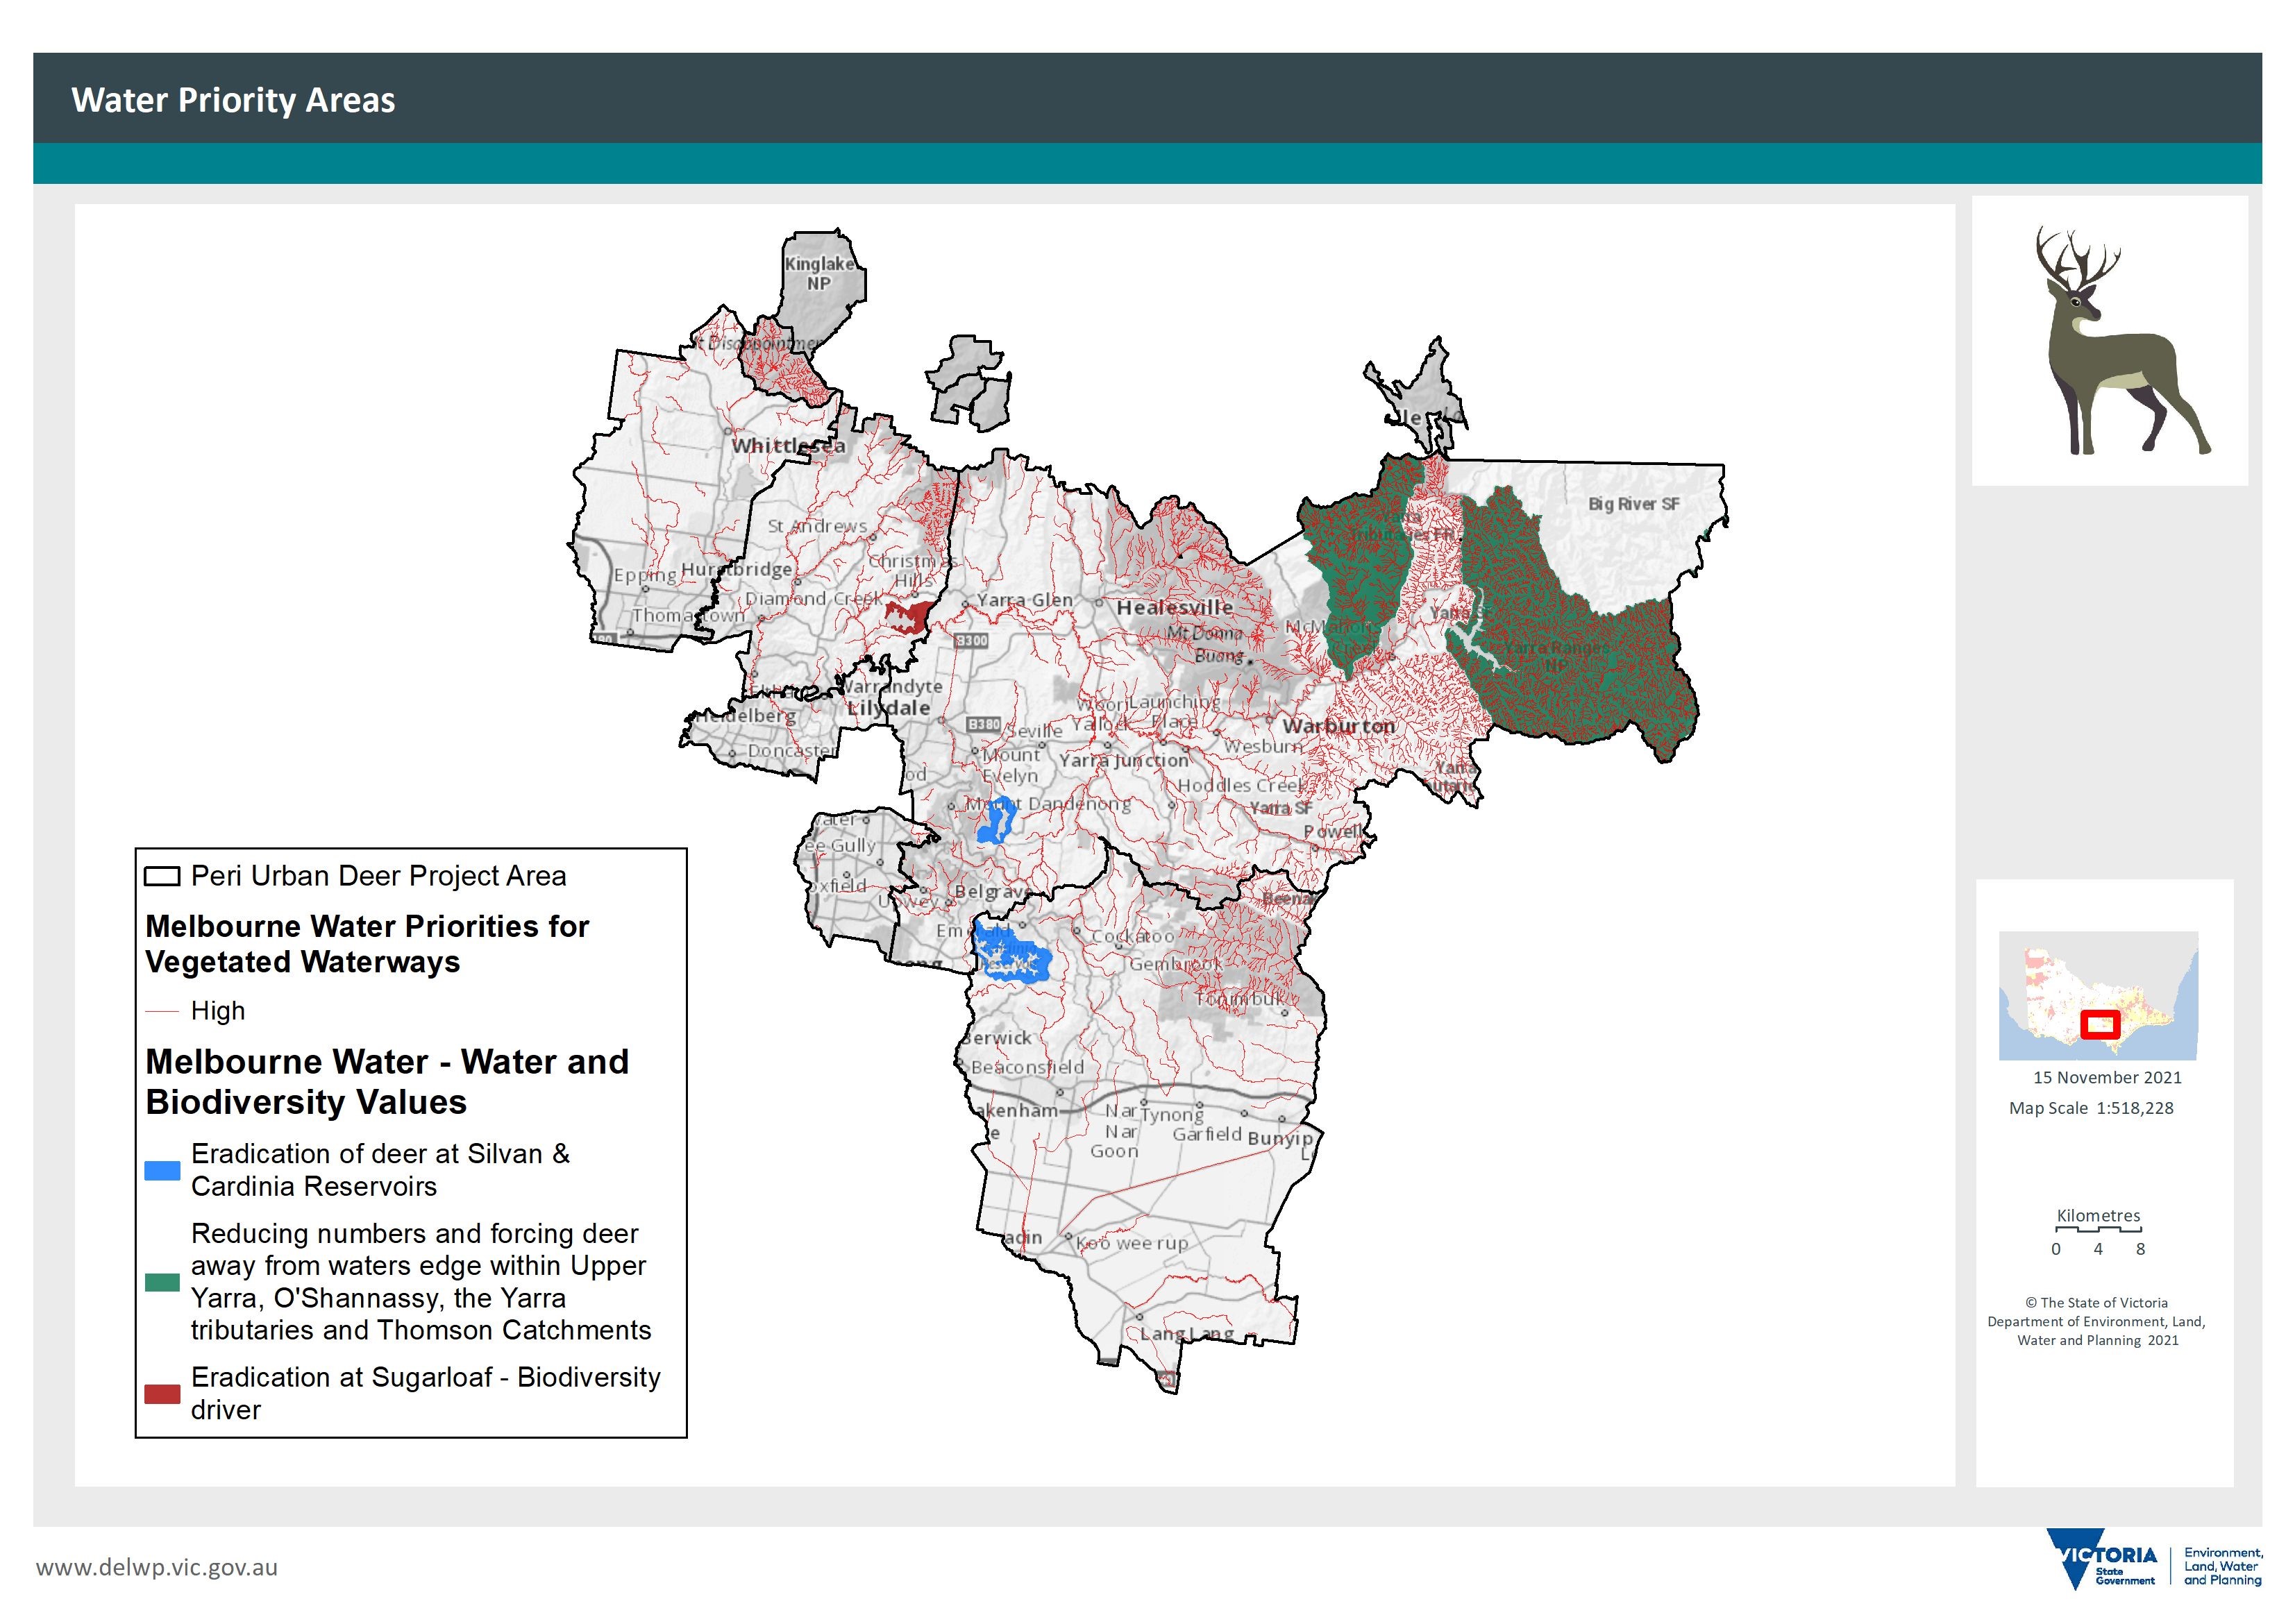
Figure 12: Water priority reserves
Parks Victoria priority reserves across the Peri-Urban area
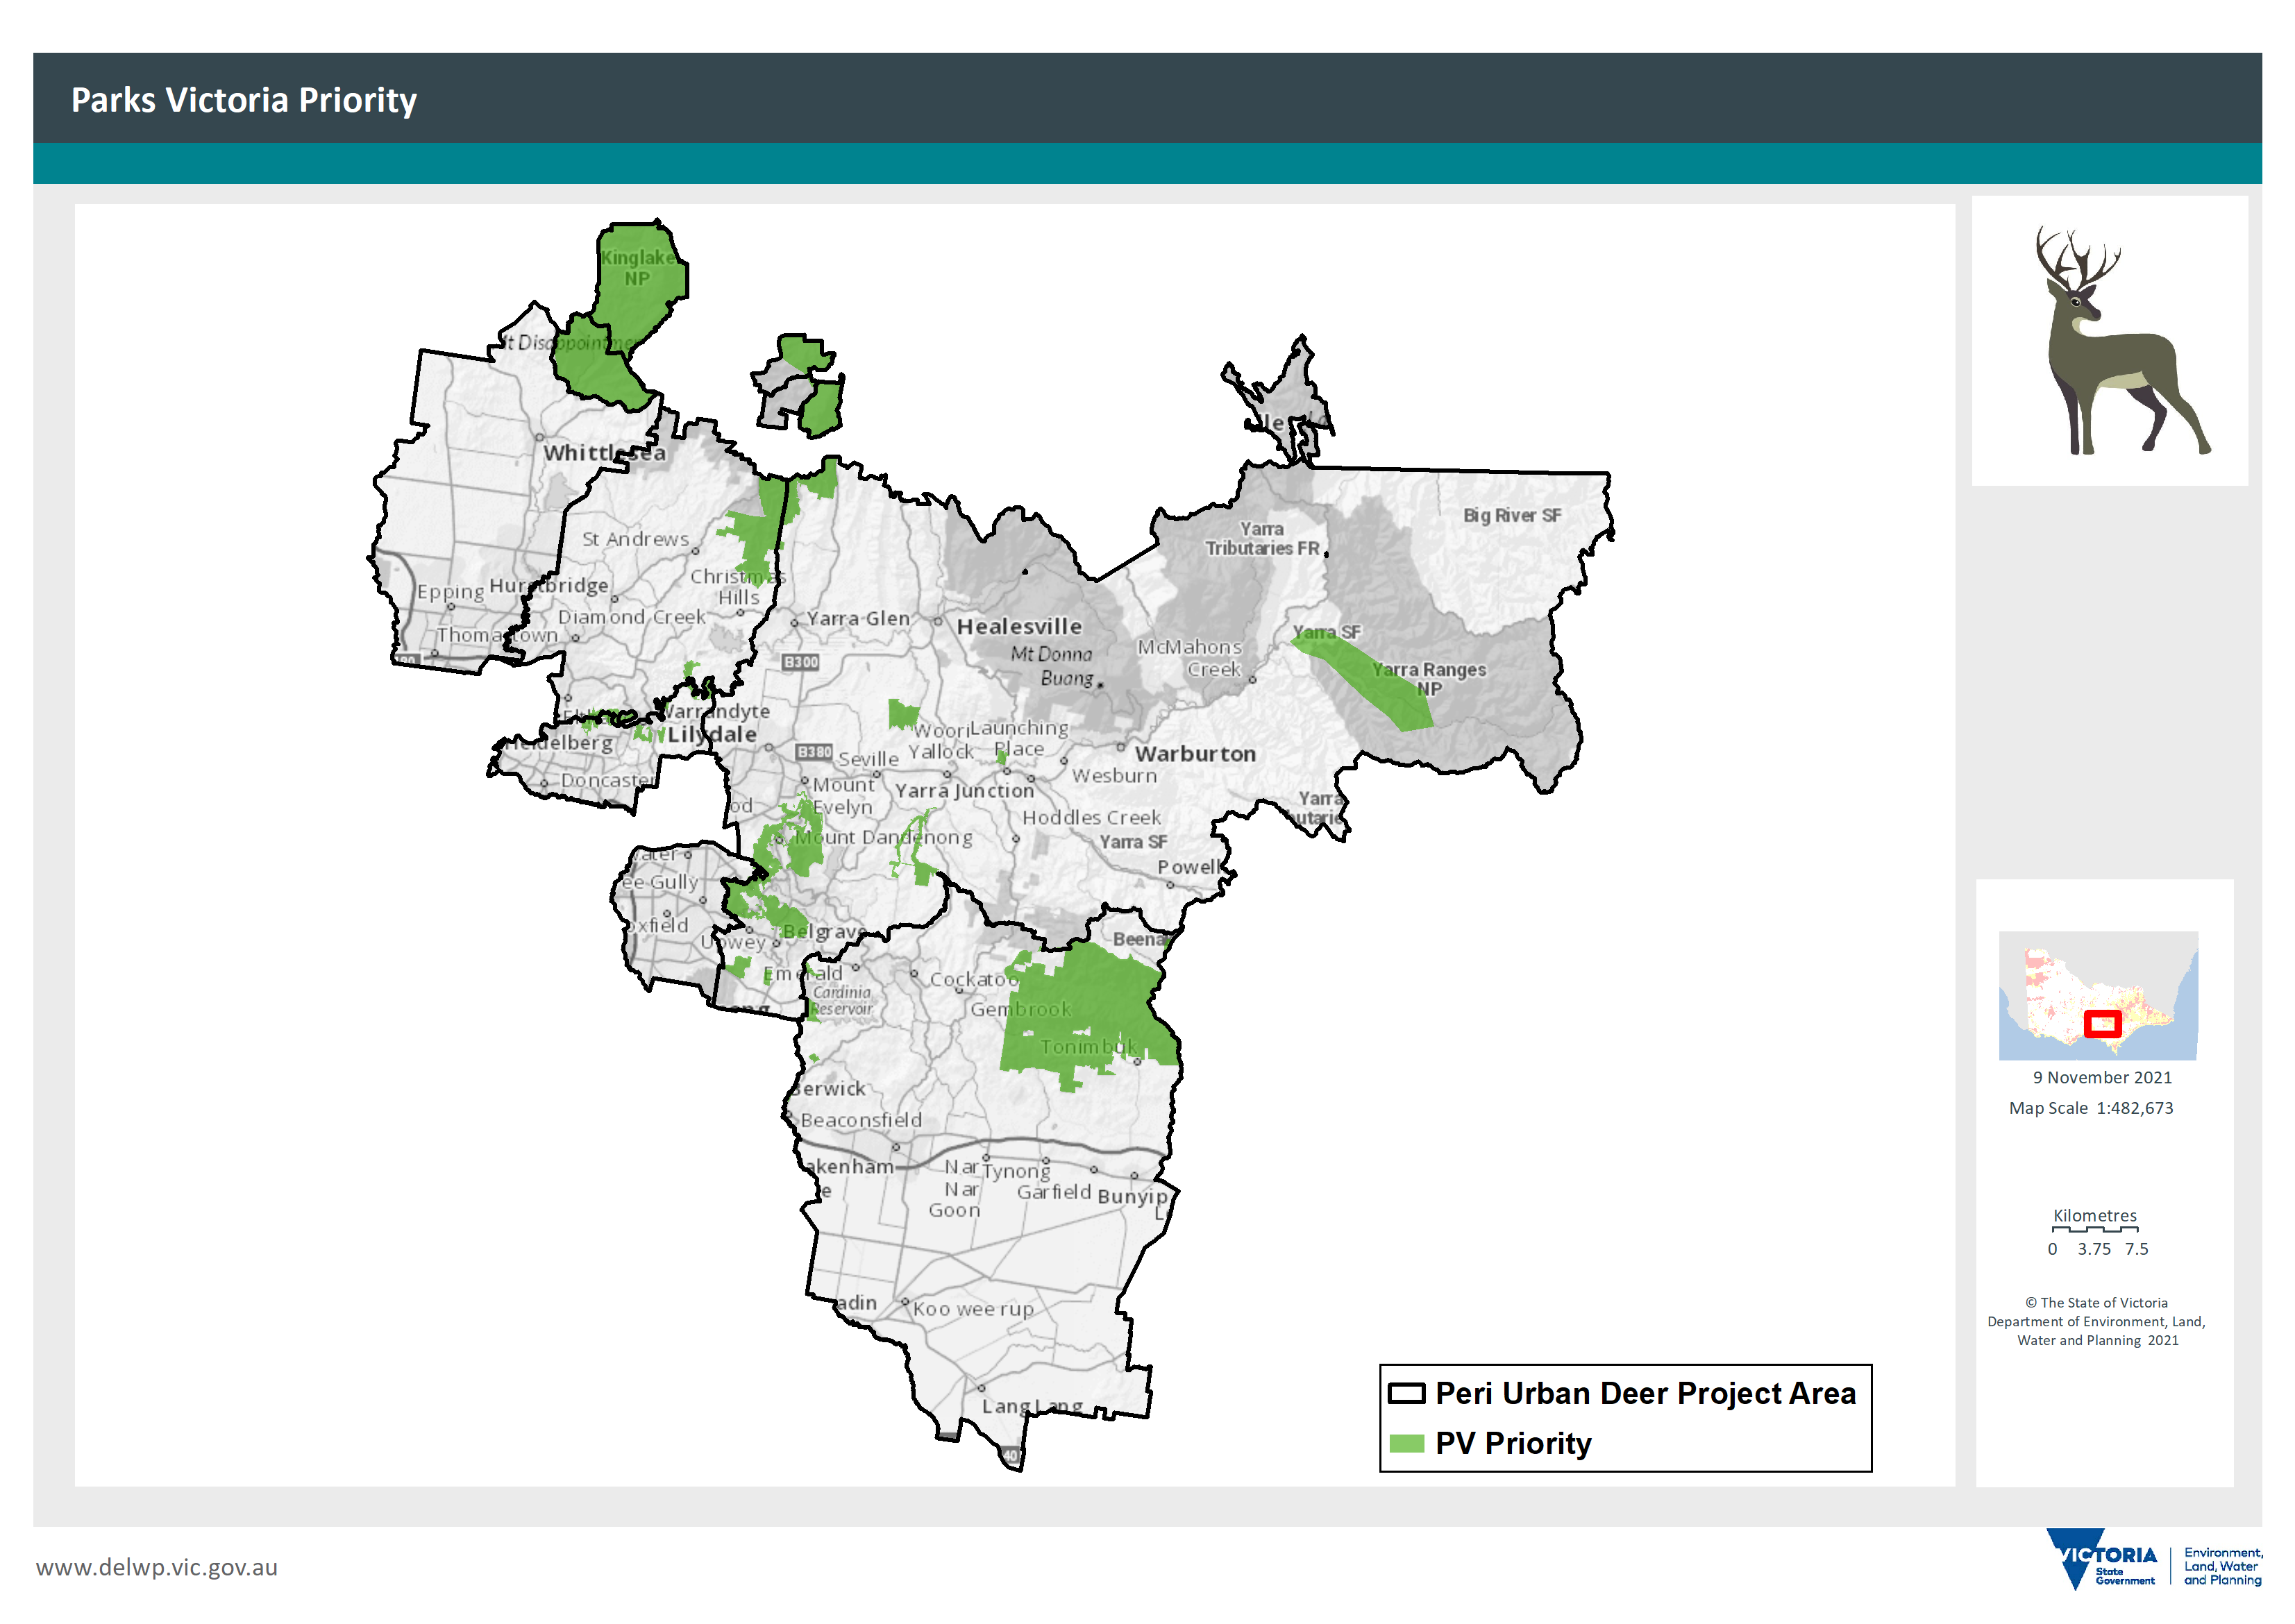
Figure 13: Parks Victoria deer management priorities
Maps Used to develop priority areas map
Strategic Management Prospects
SMP Benefit-Cost of Deer control across Victoria
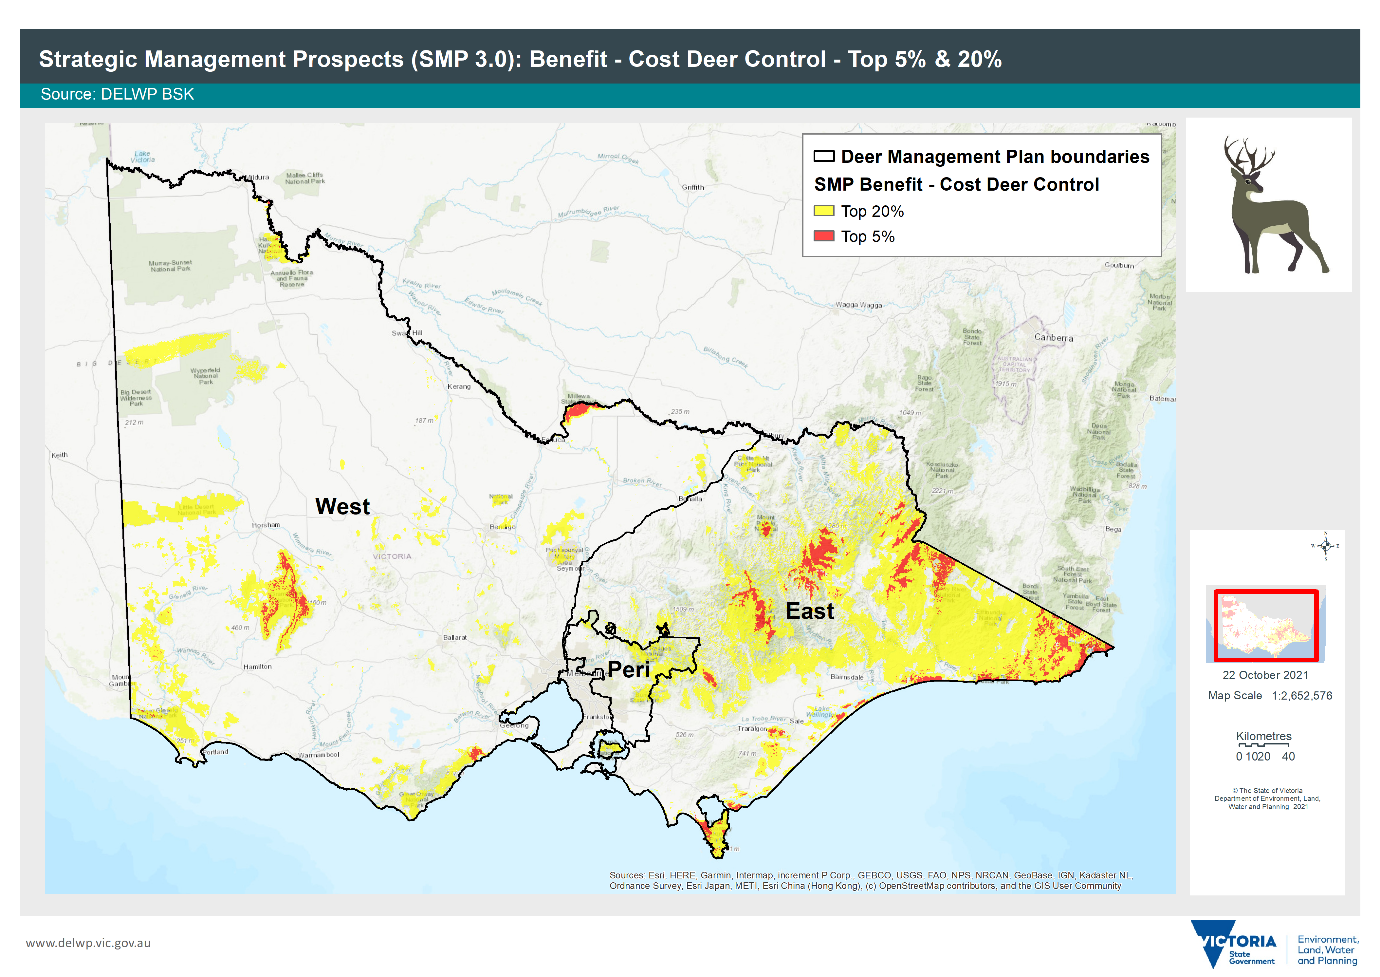
Figure 14: indicates the top 5 and 20 per cent sites across Victoria that provide high-cost benefits to a range of species through deer control
SMP Benefit-Cost of Deer Control across the Peri-Urban area
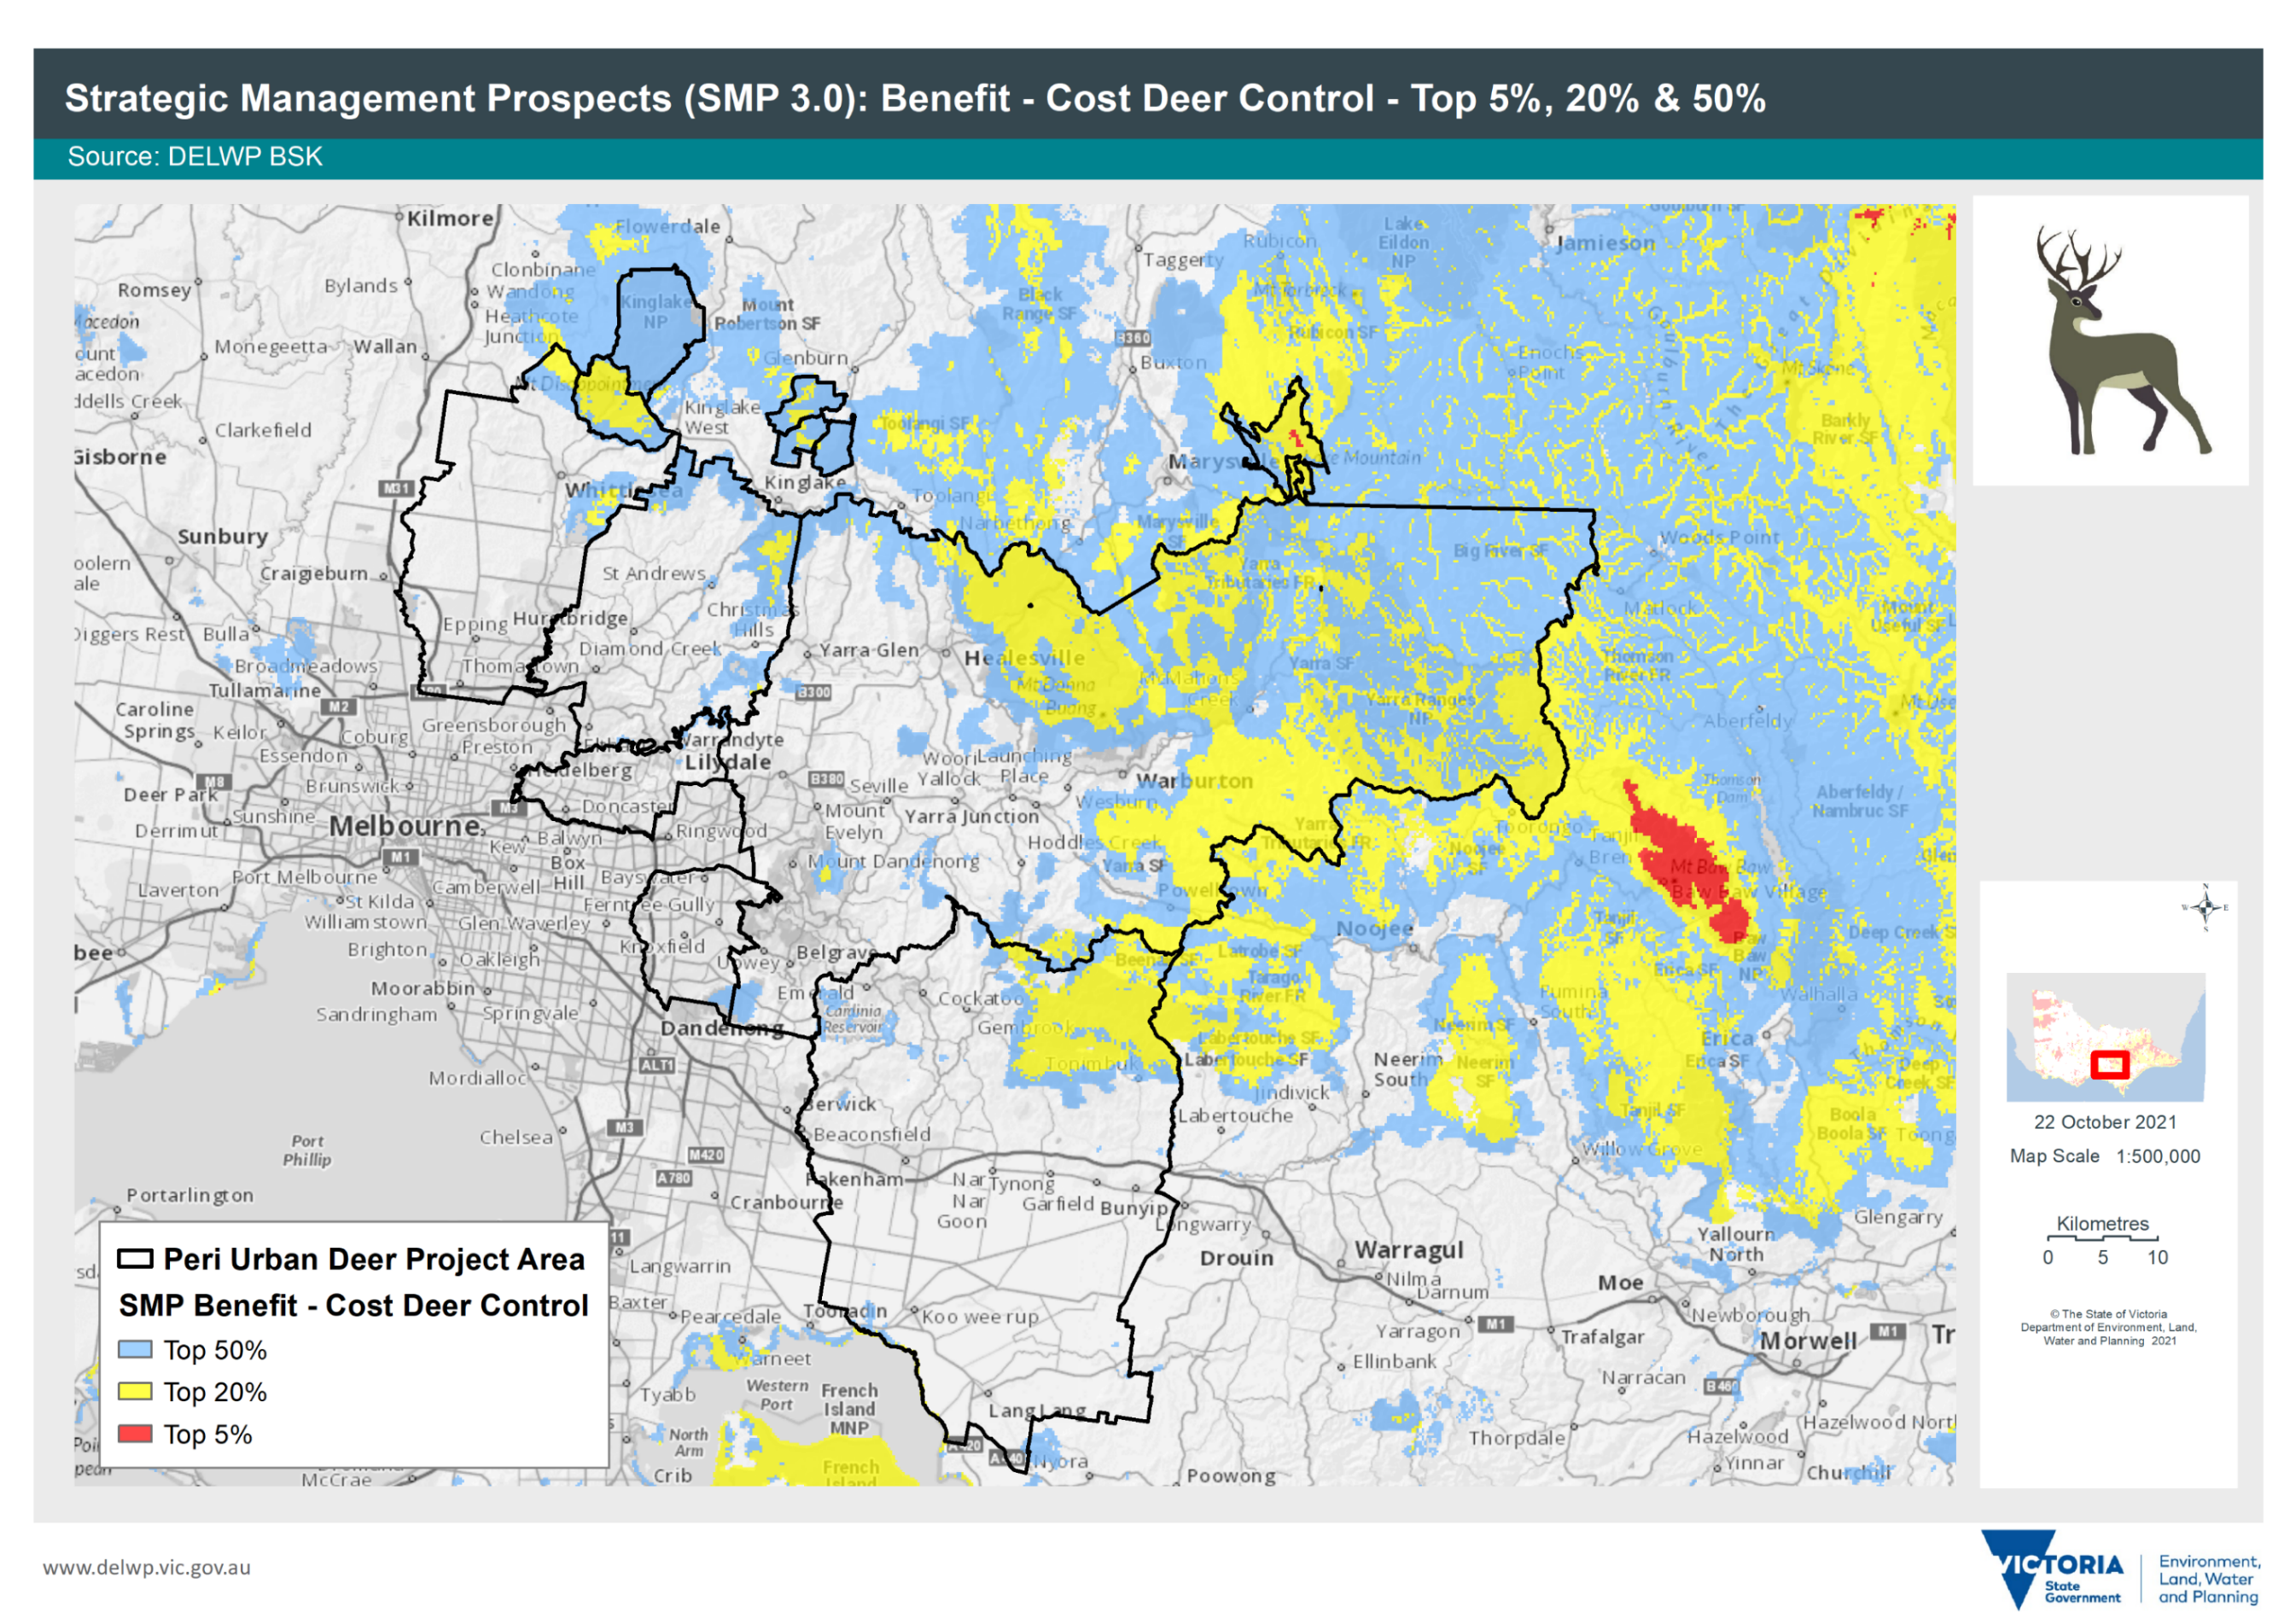
Figure 15: Strategic Management Prospects map of Benefit-Cost of Deer control
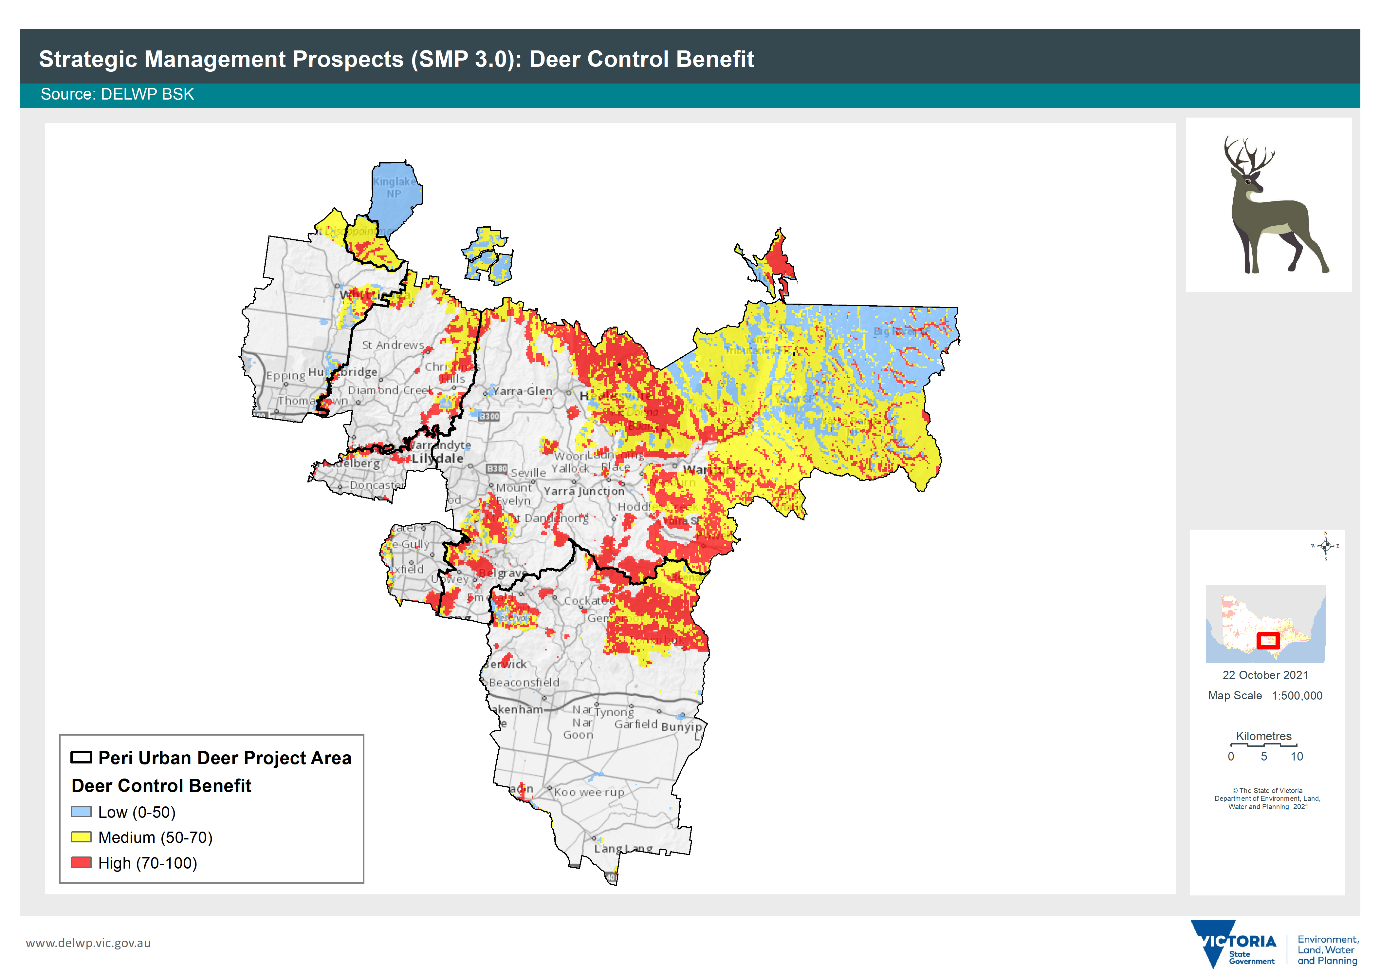
Figure 16: Strategic Management Prospects - Deer Control Benefit
Land Use
Land Use by Type across the Peri-Urban area
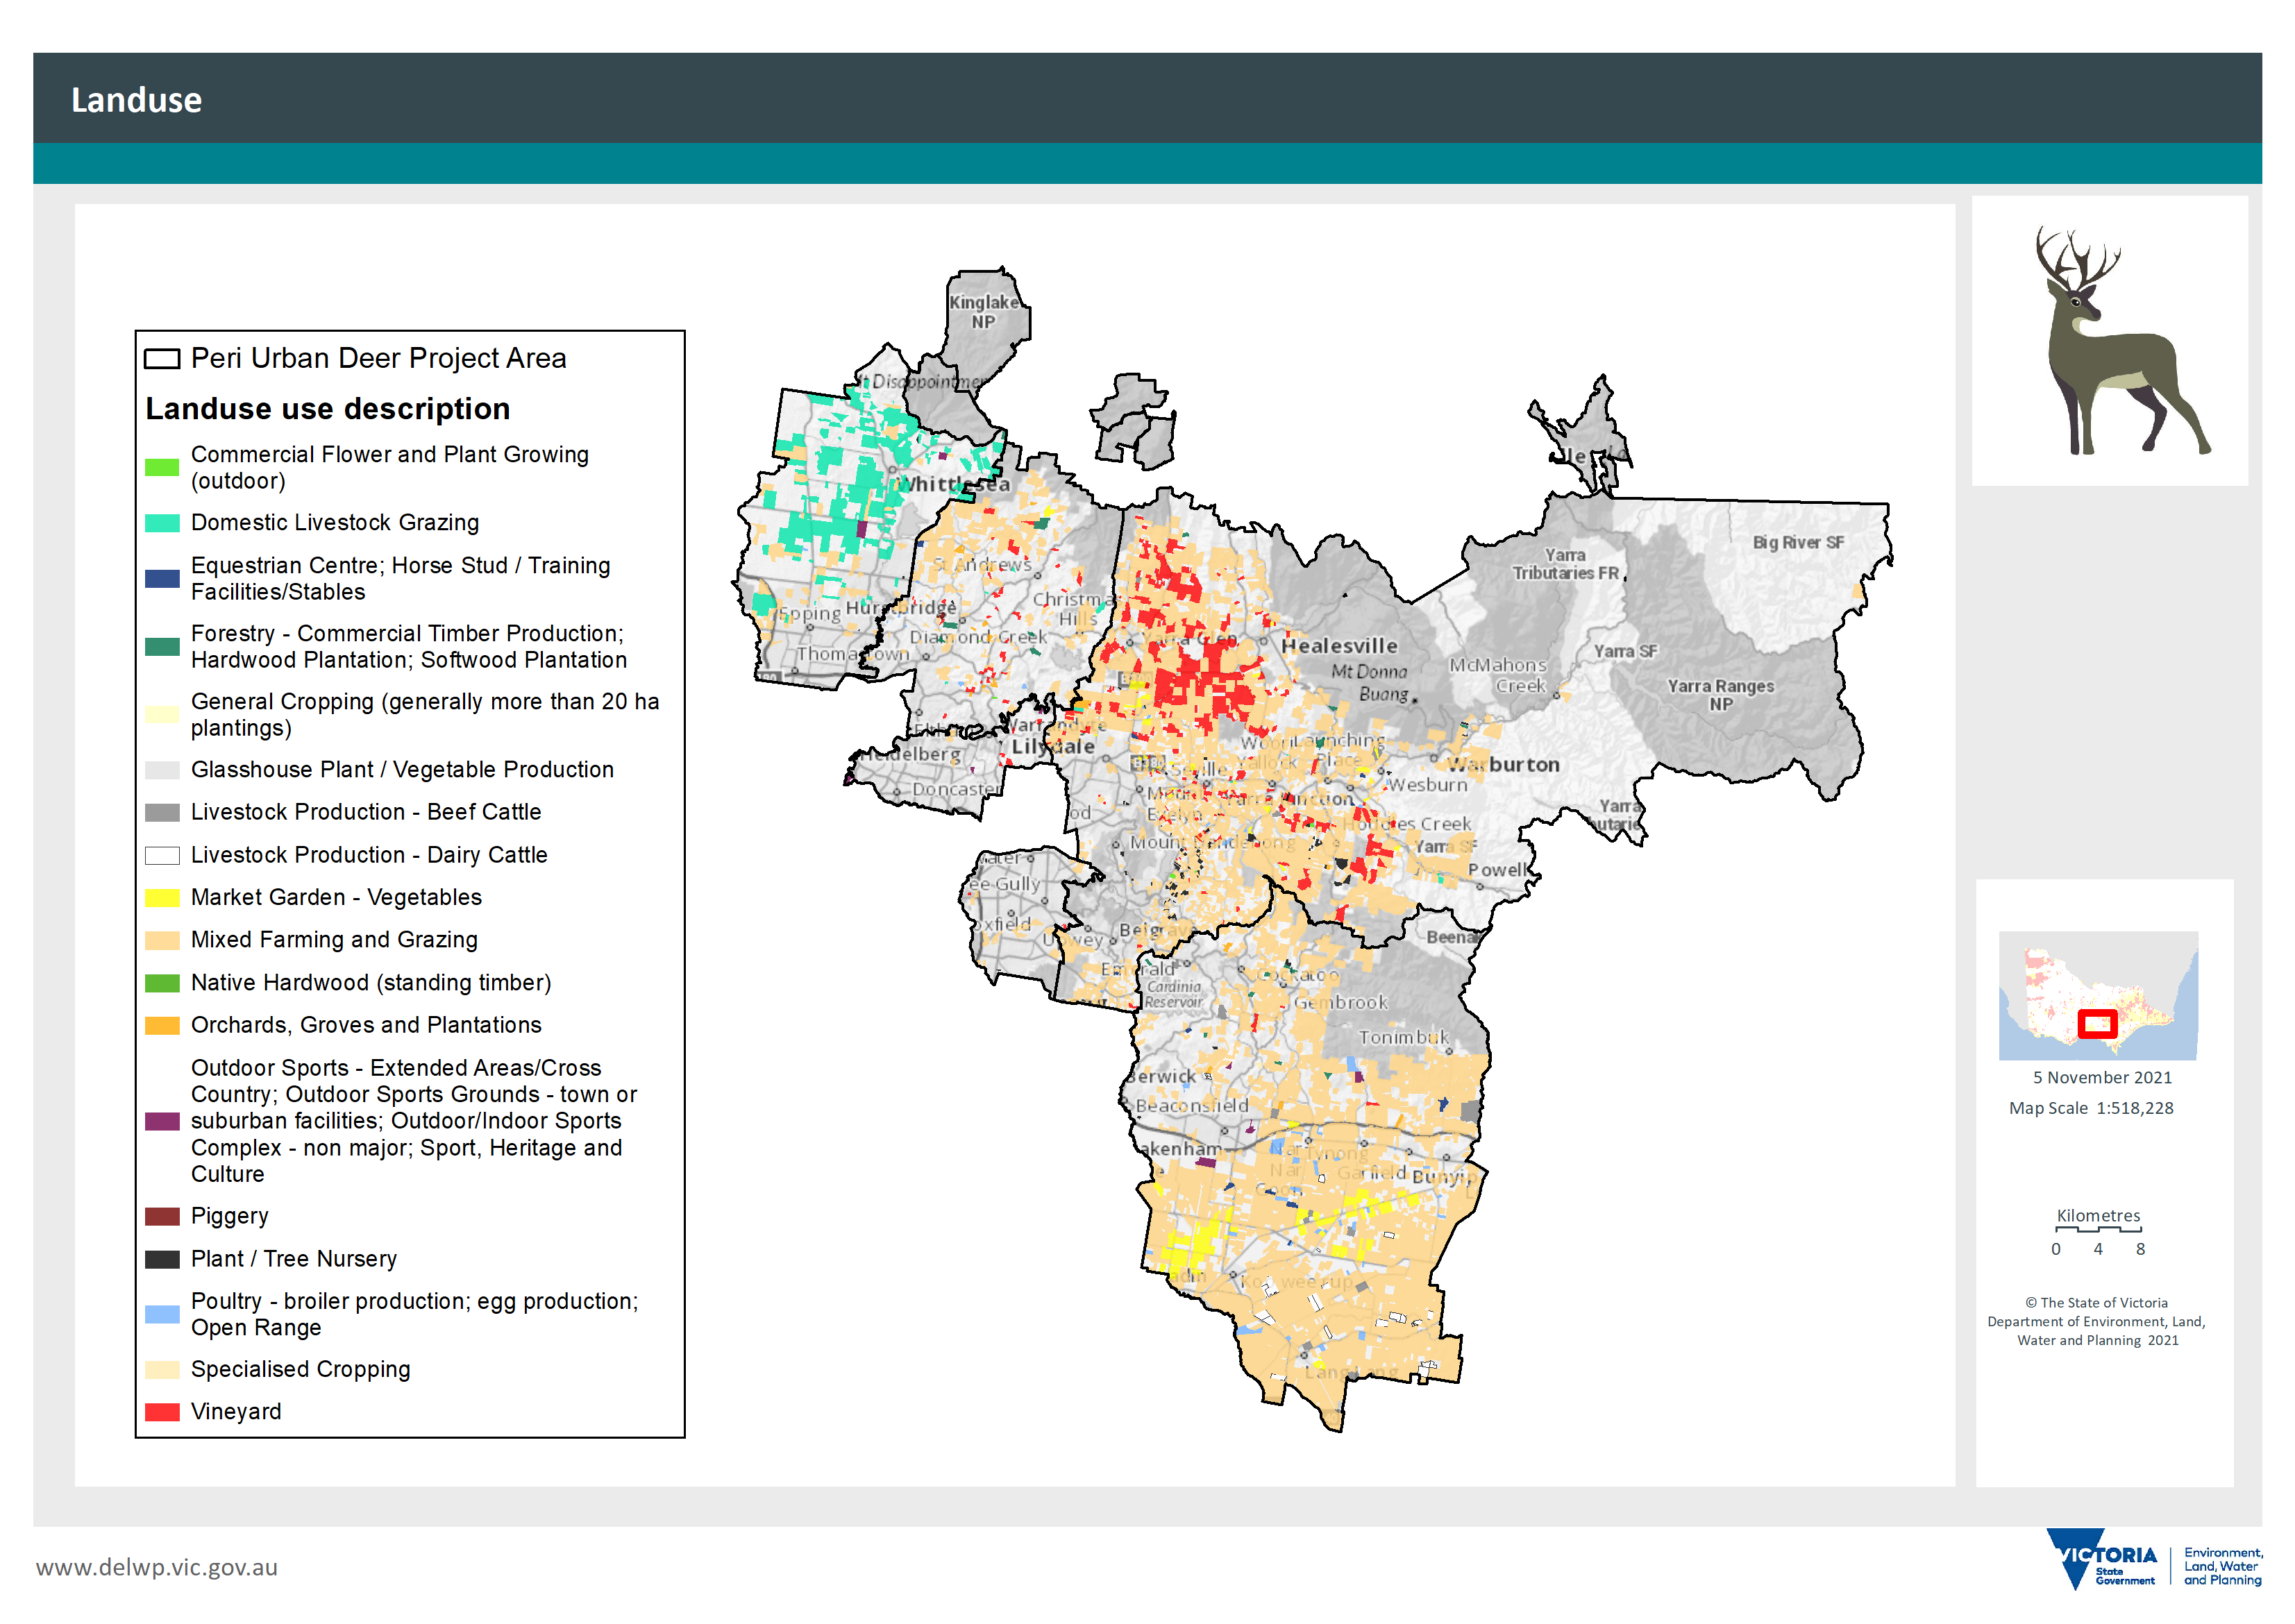
Figure 17: Land use across the peri-urban area
Land use-values ranked across the peri-urban area
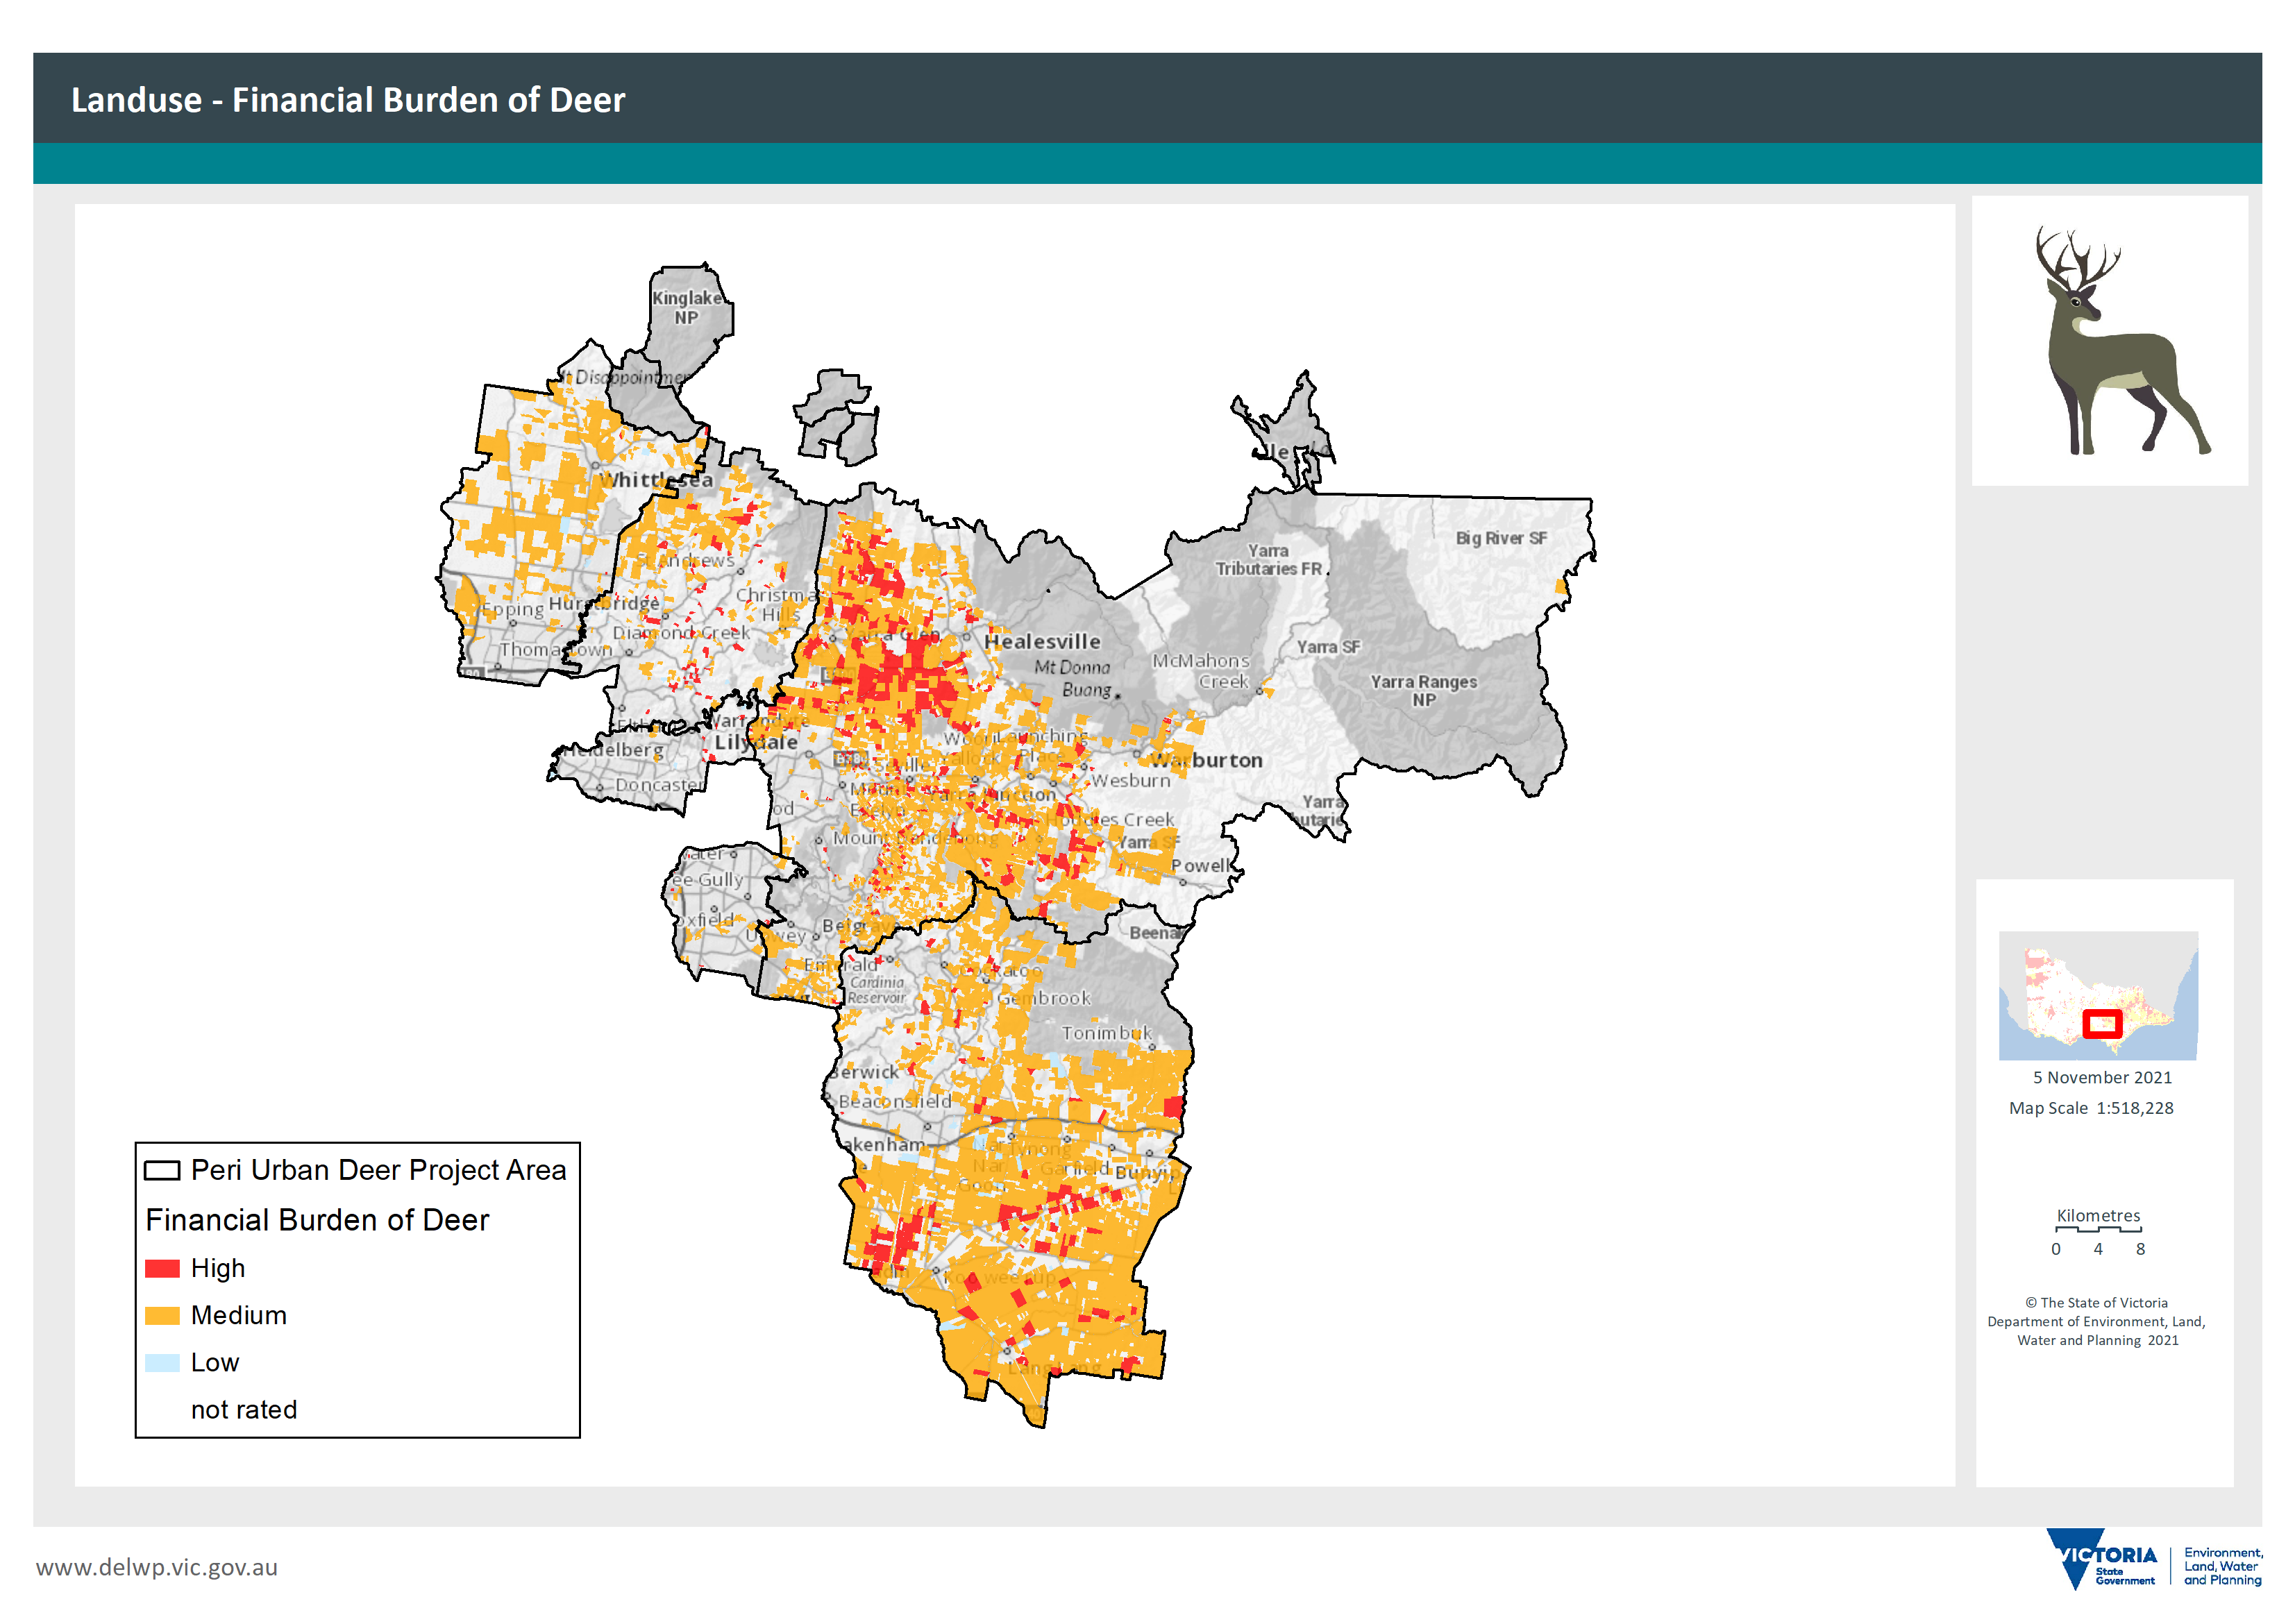
Figure 18: Land use classified into high, medium or low determine sites of importance.
Aboriginal Cultural Heritage values across the Peri-Urban area
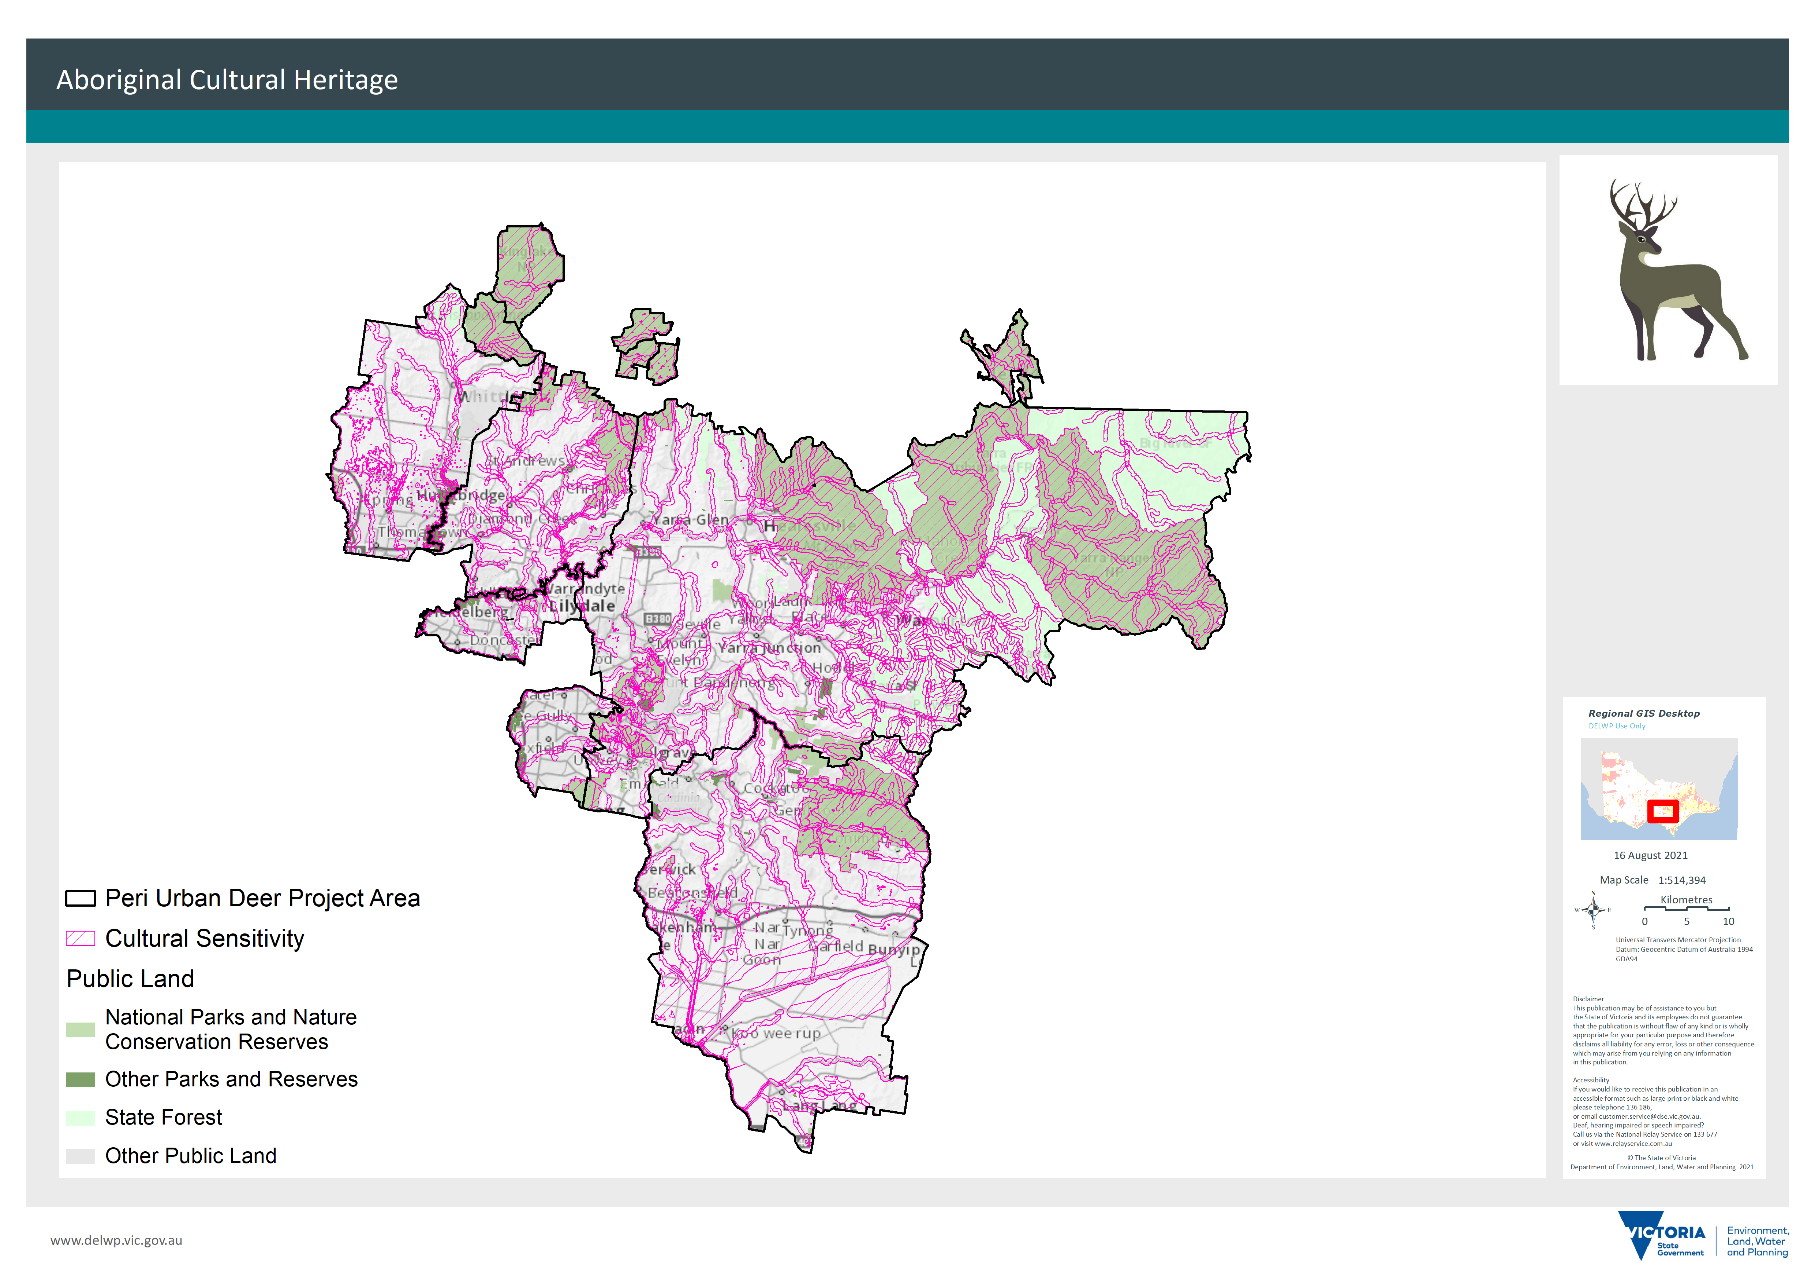
Figure 19: Aboriginal cultural heritage map
Deer distribution across the Peri-Urban area
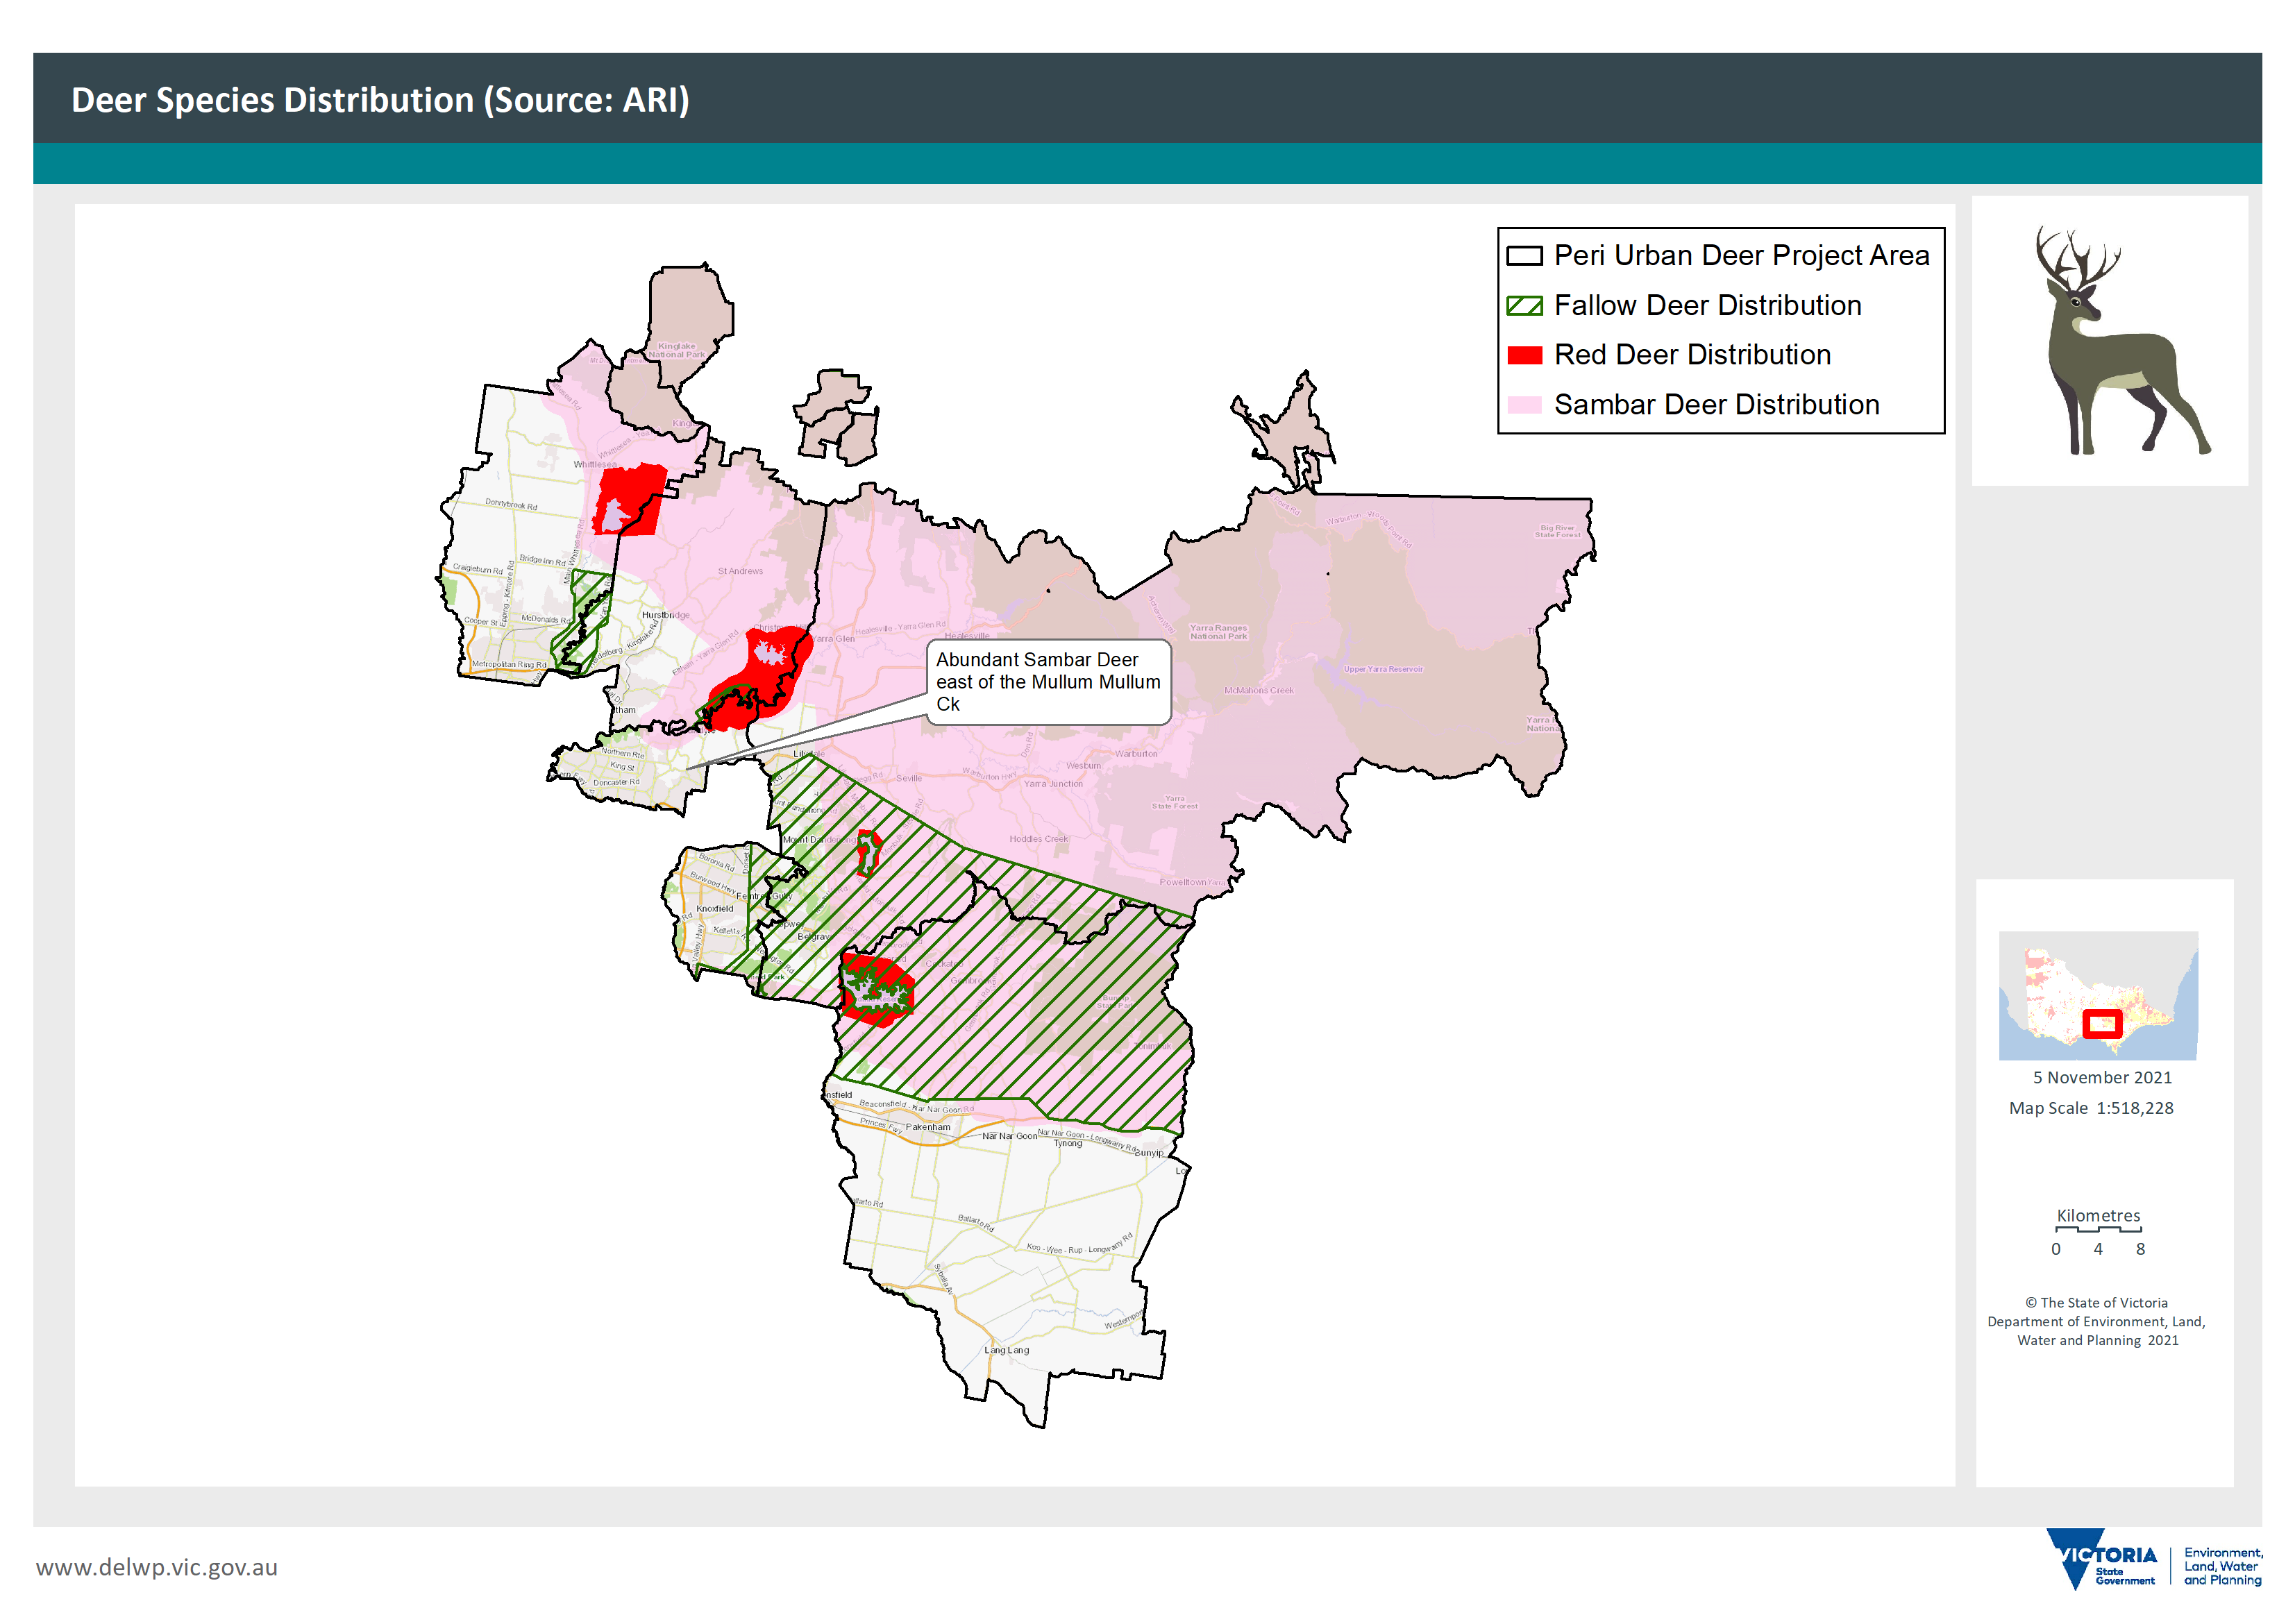
Figure 20: Deer species distribution map
Deer-Vehicle Collisions across the Peri-Urban area
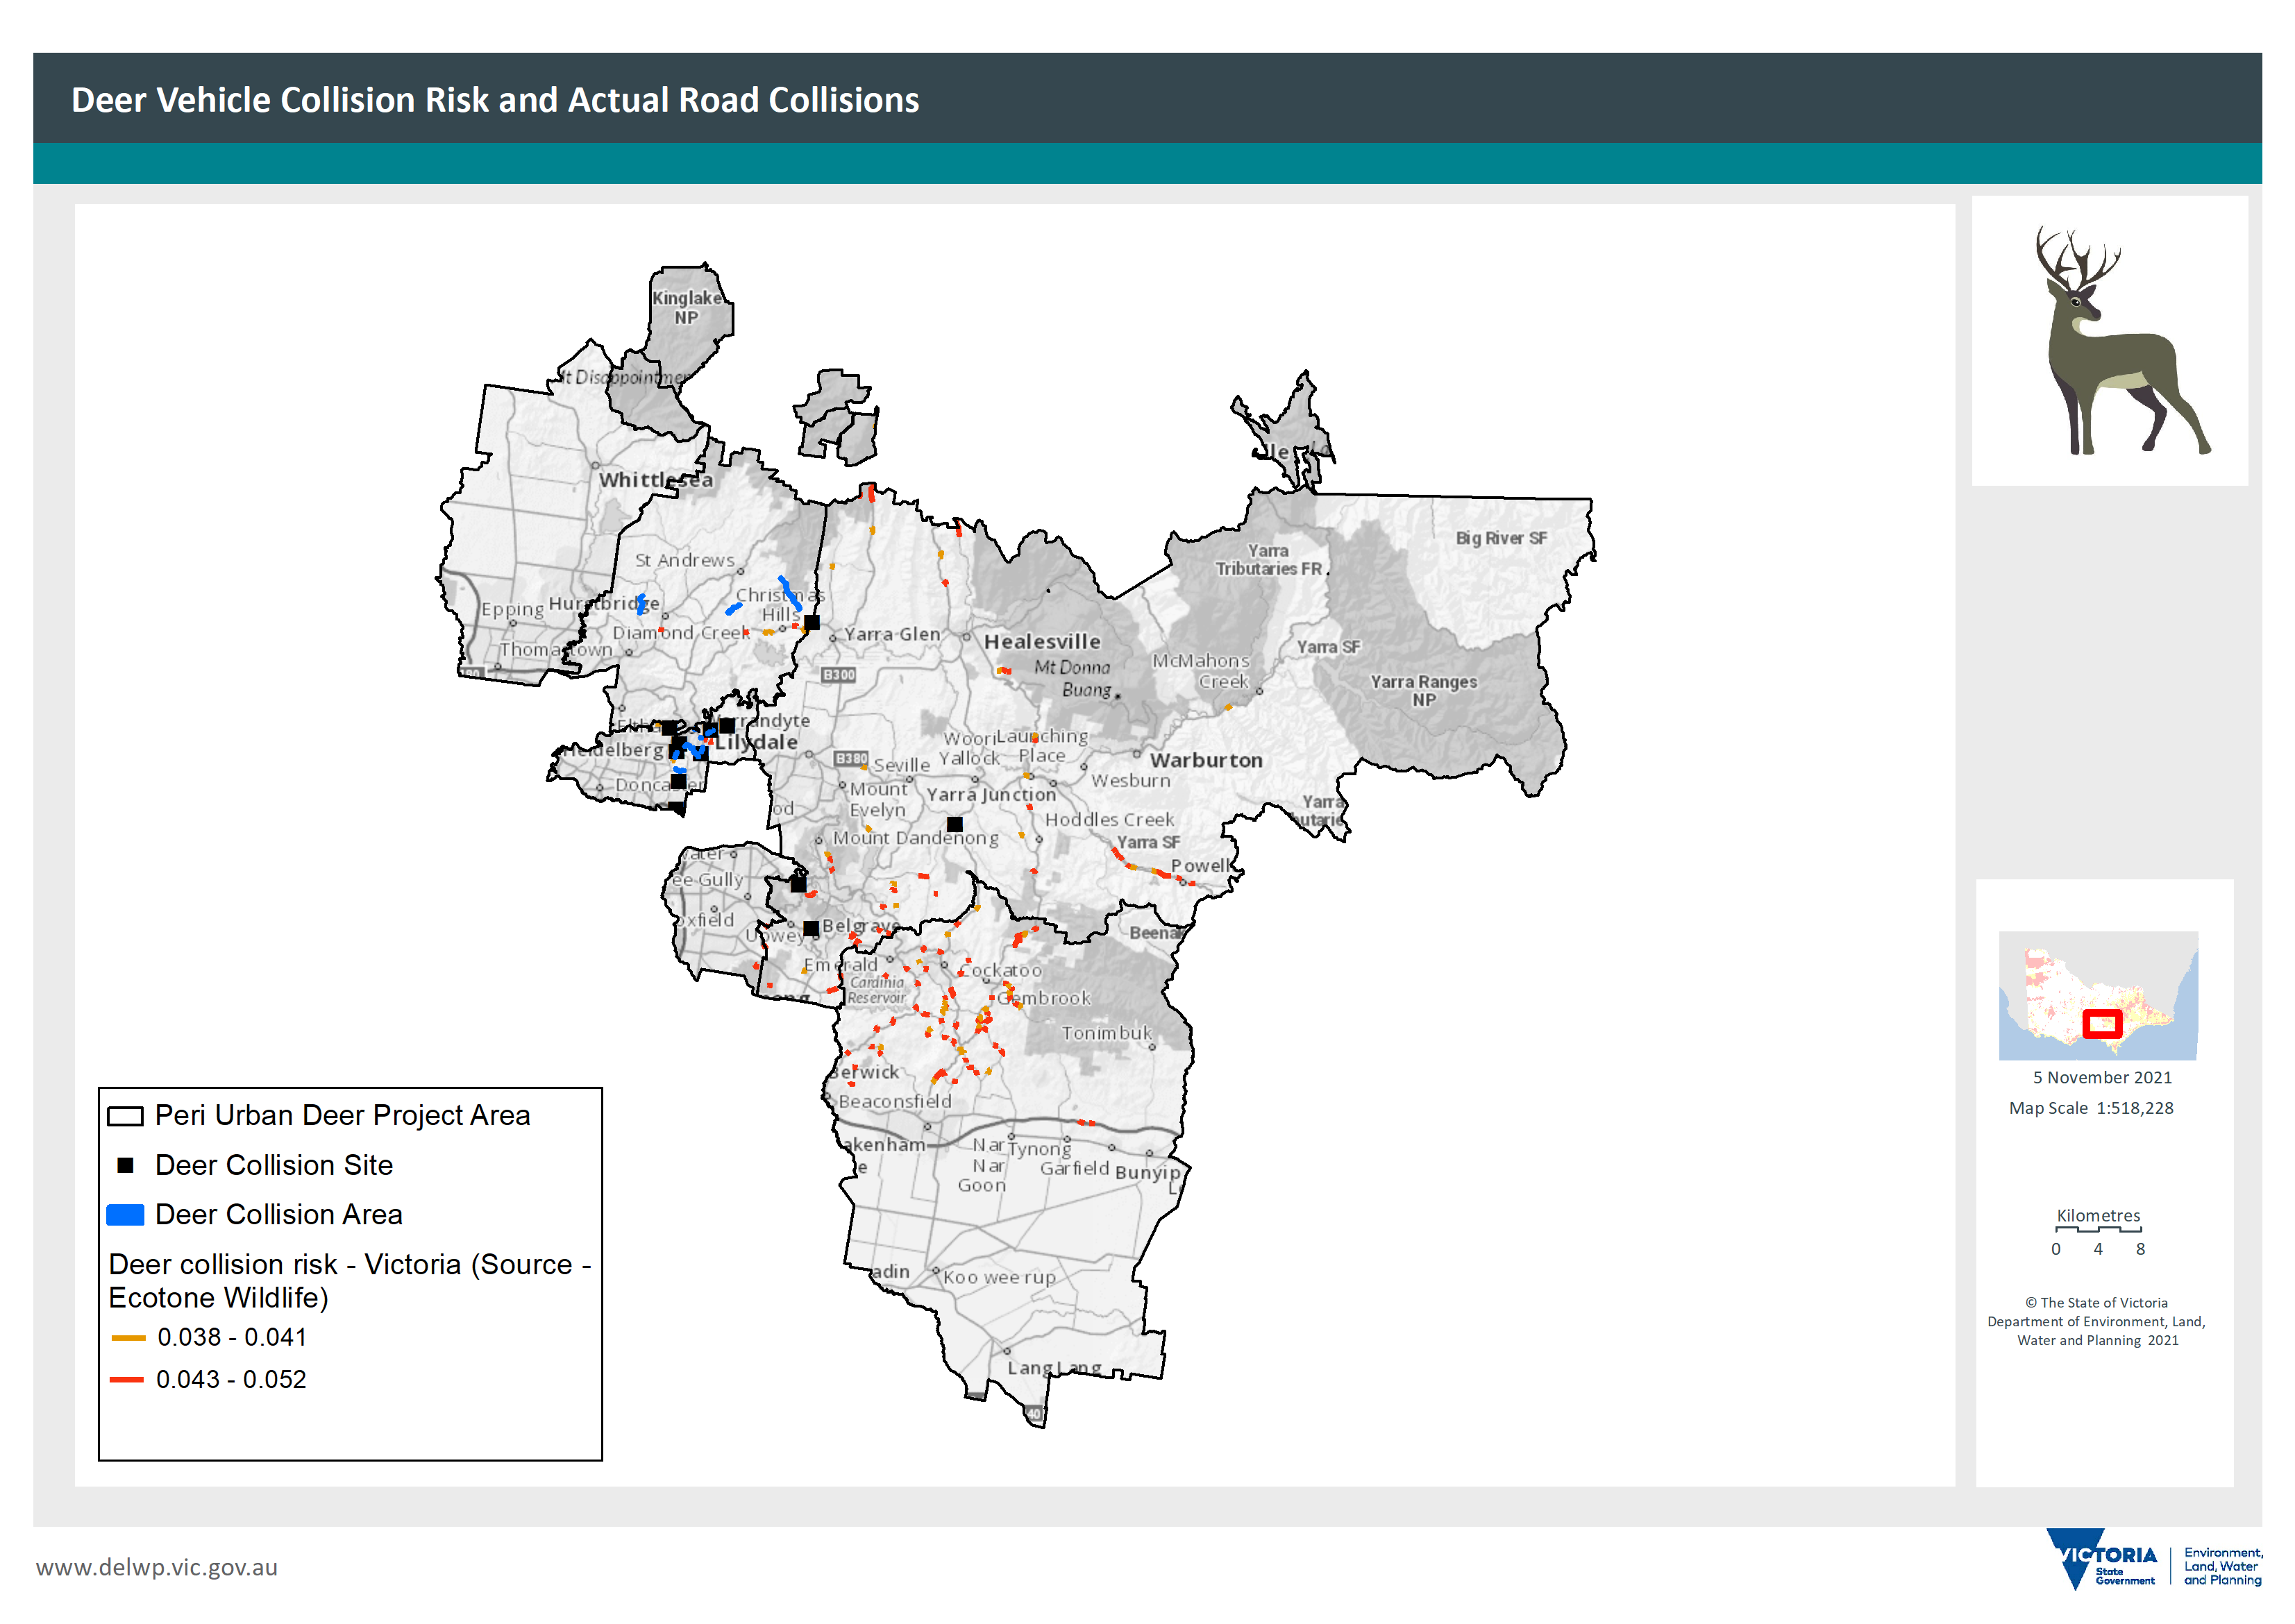
Figure 21: Deer–vehicle collision risk and road collisions map
Supporting maps
SMP Benefit-Cost, Biodiversity Response Planning (BRP) deer projects and Camera Monitoring across the Peri-Urban area
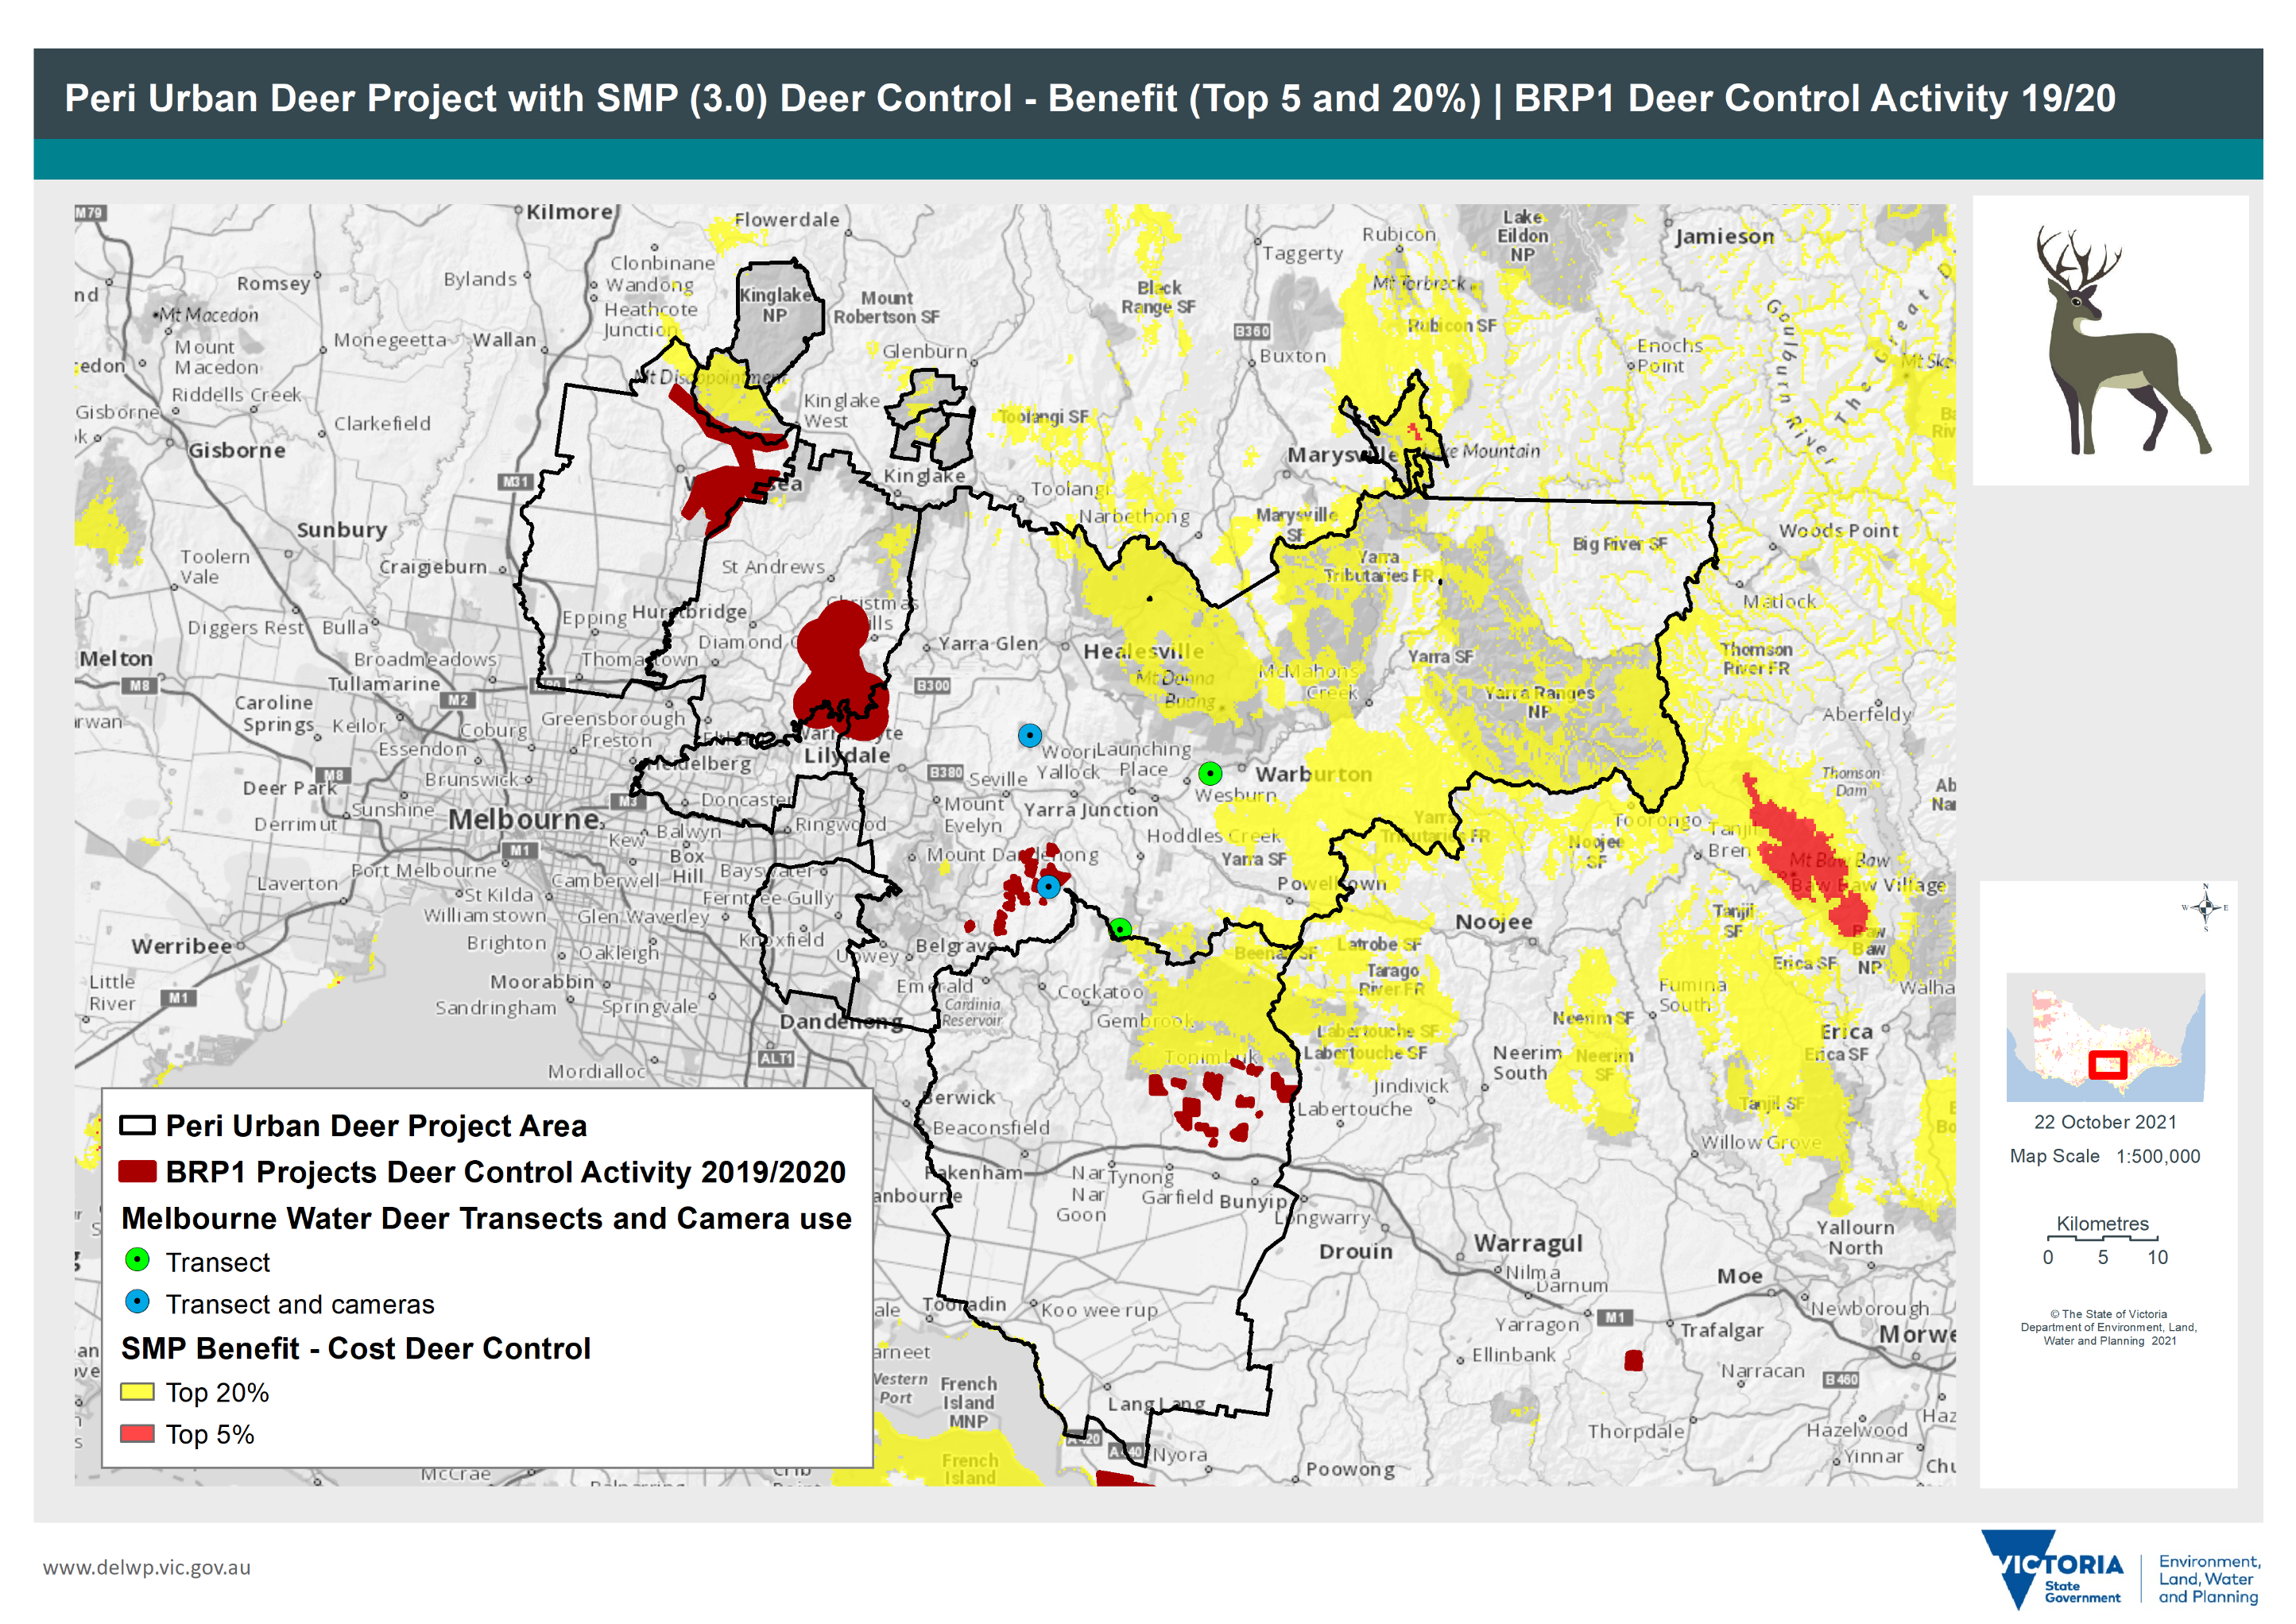
Figure 22: Peri-urban SMP and BRP 2019–20 map cameras and transects
Recent deer control and management activities across the Peri-Urban area
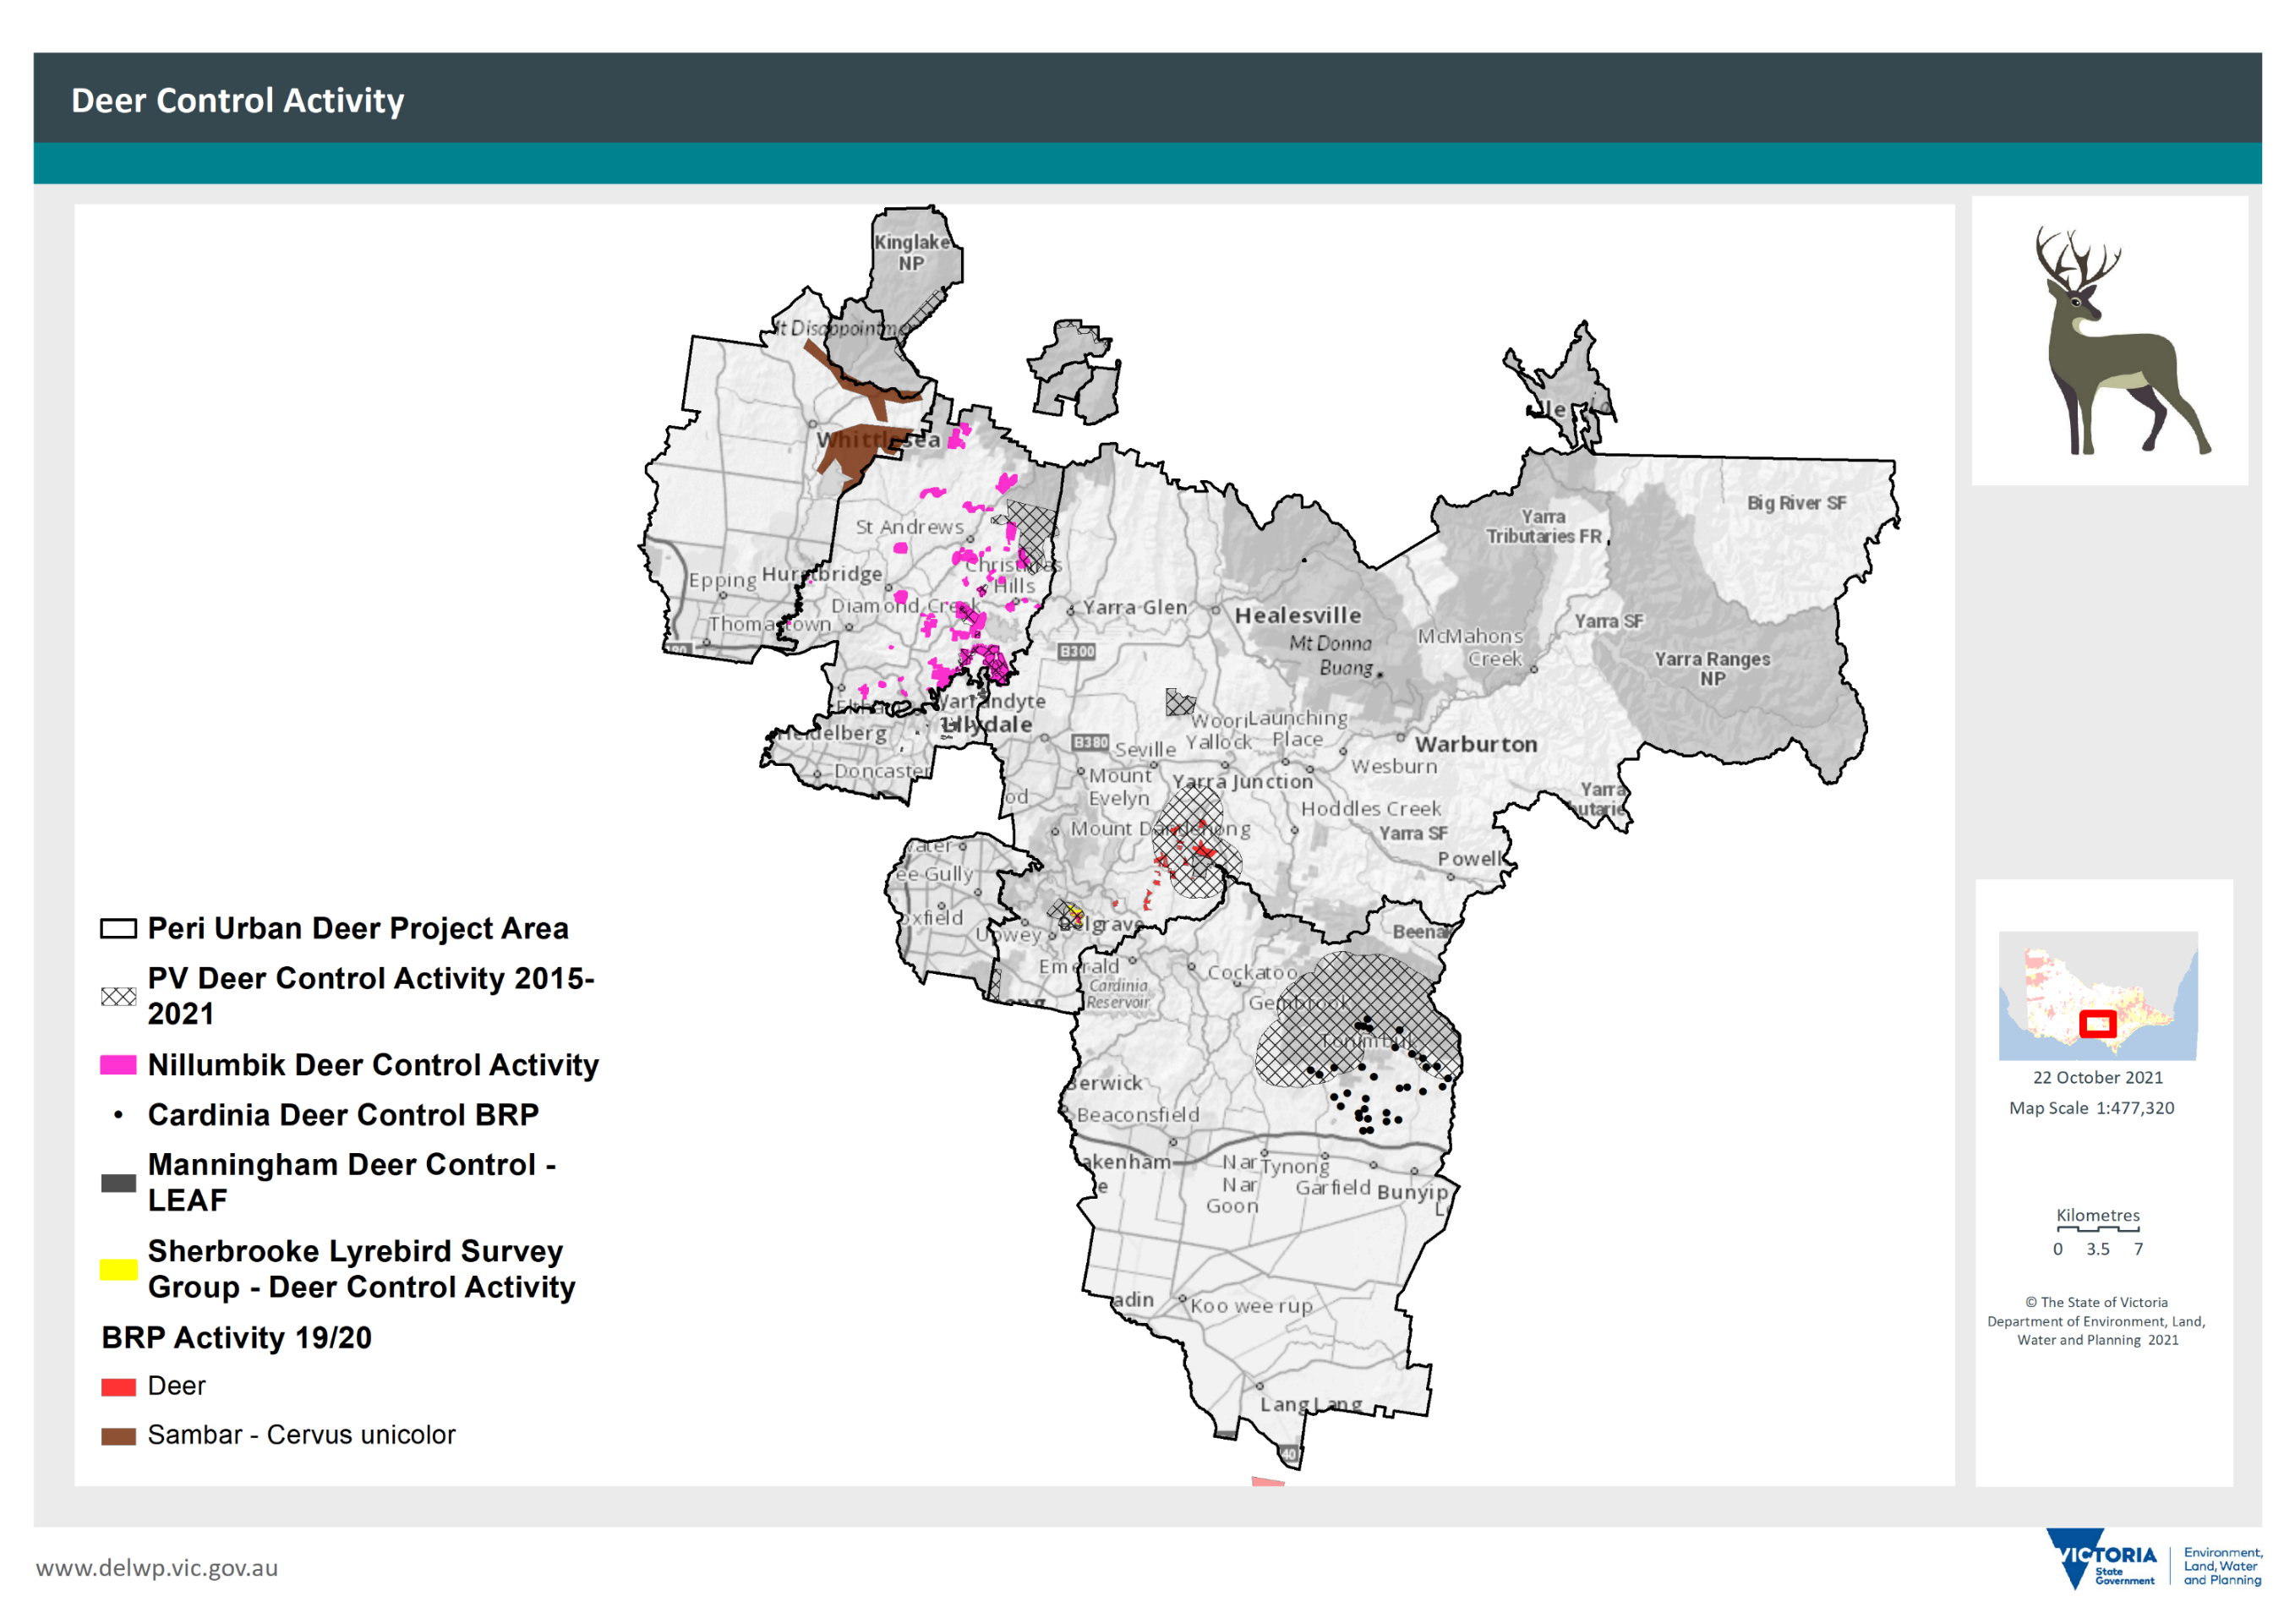
Figure 23: Deer control activity
Deer monitoring areas across the Peri-Urban area
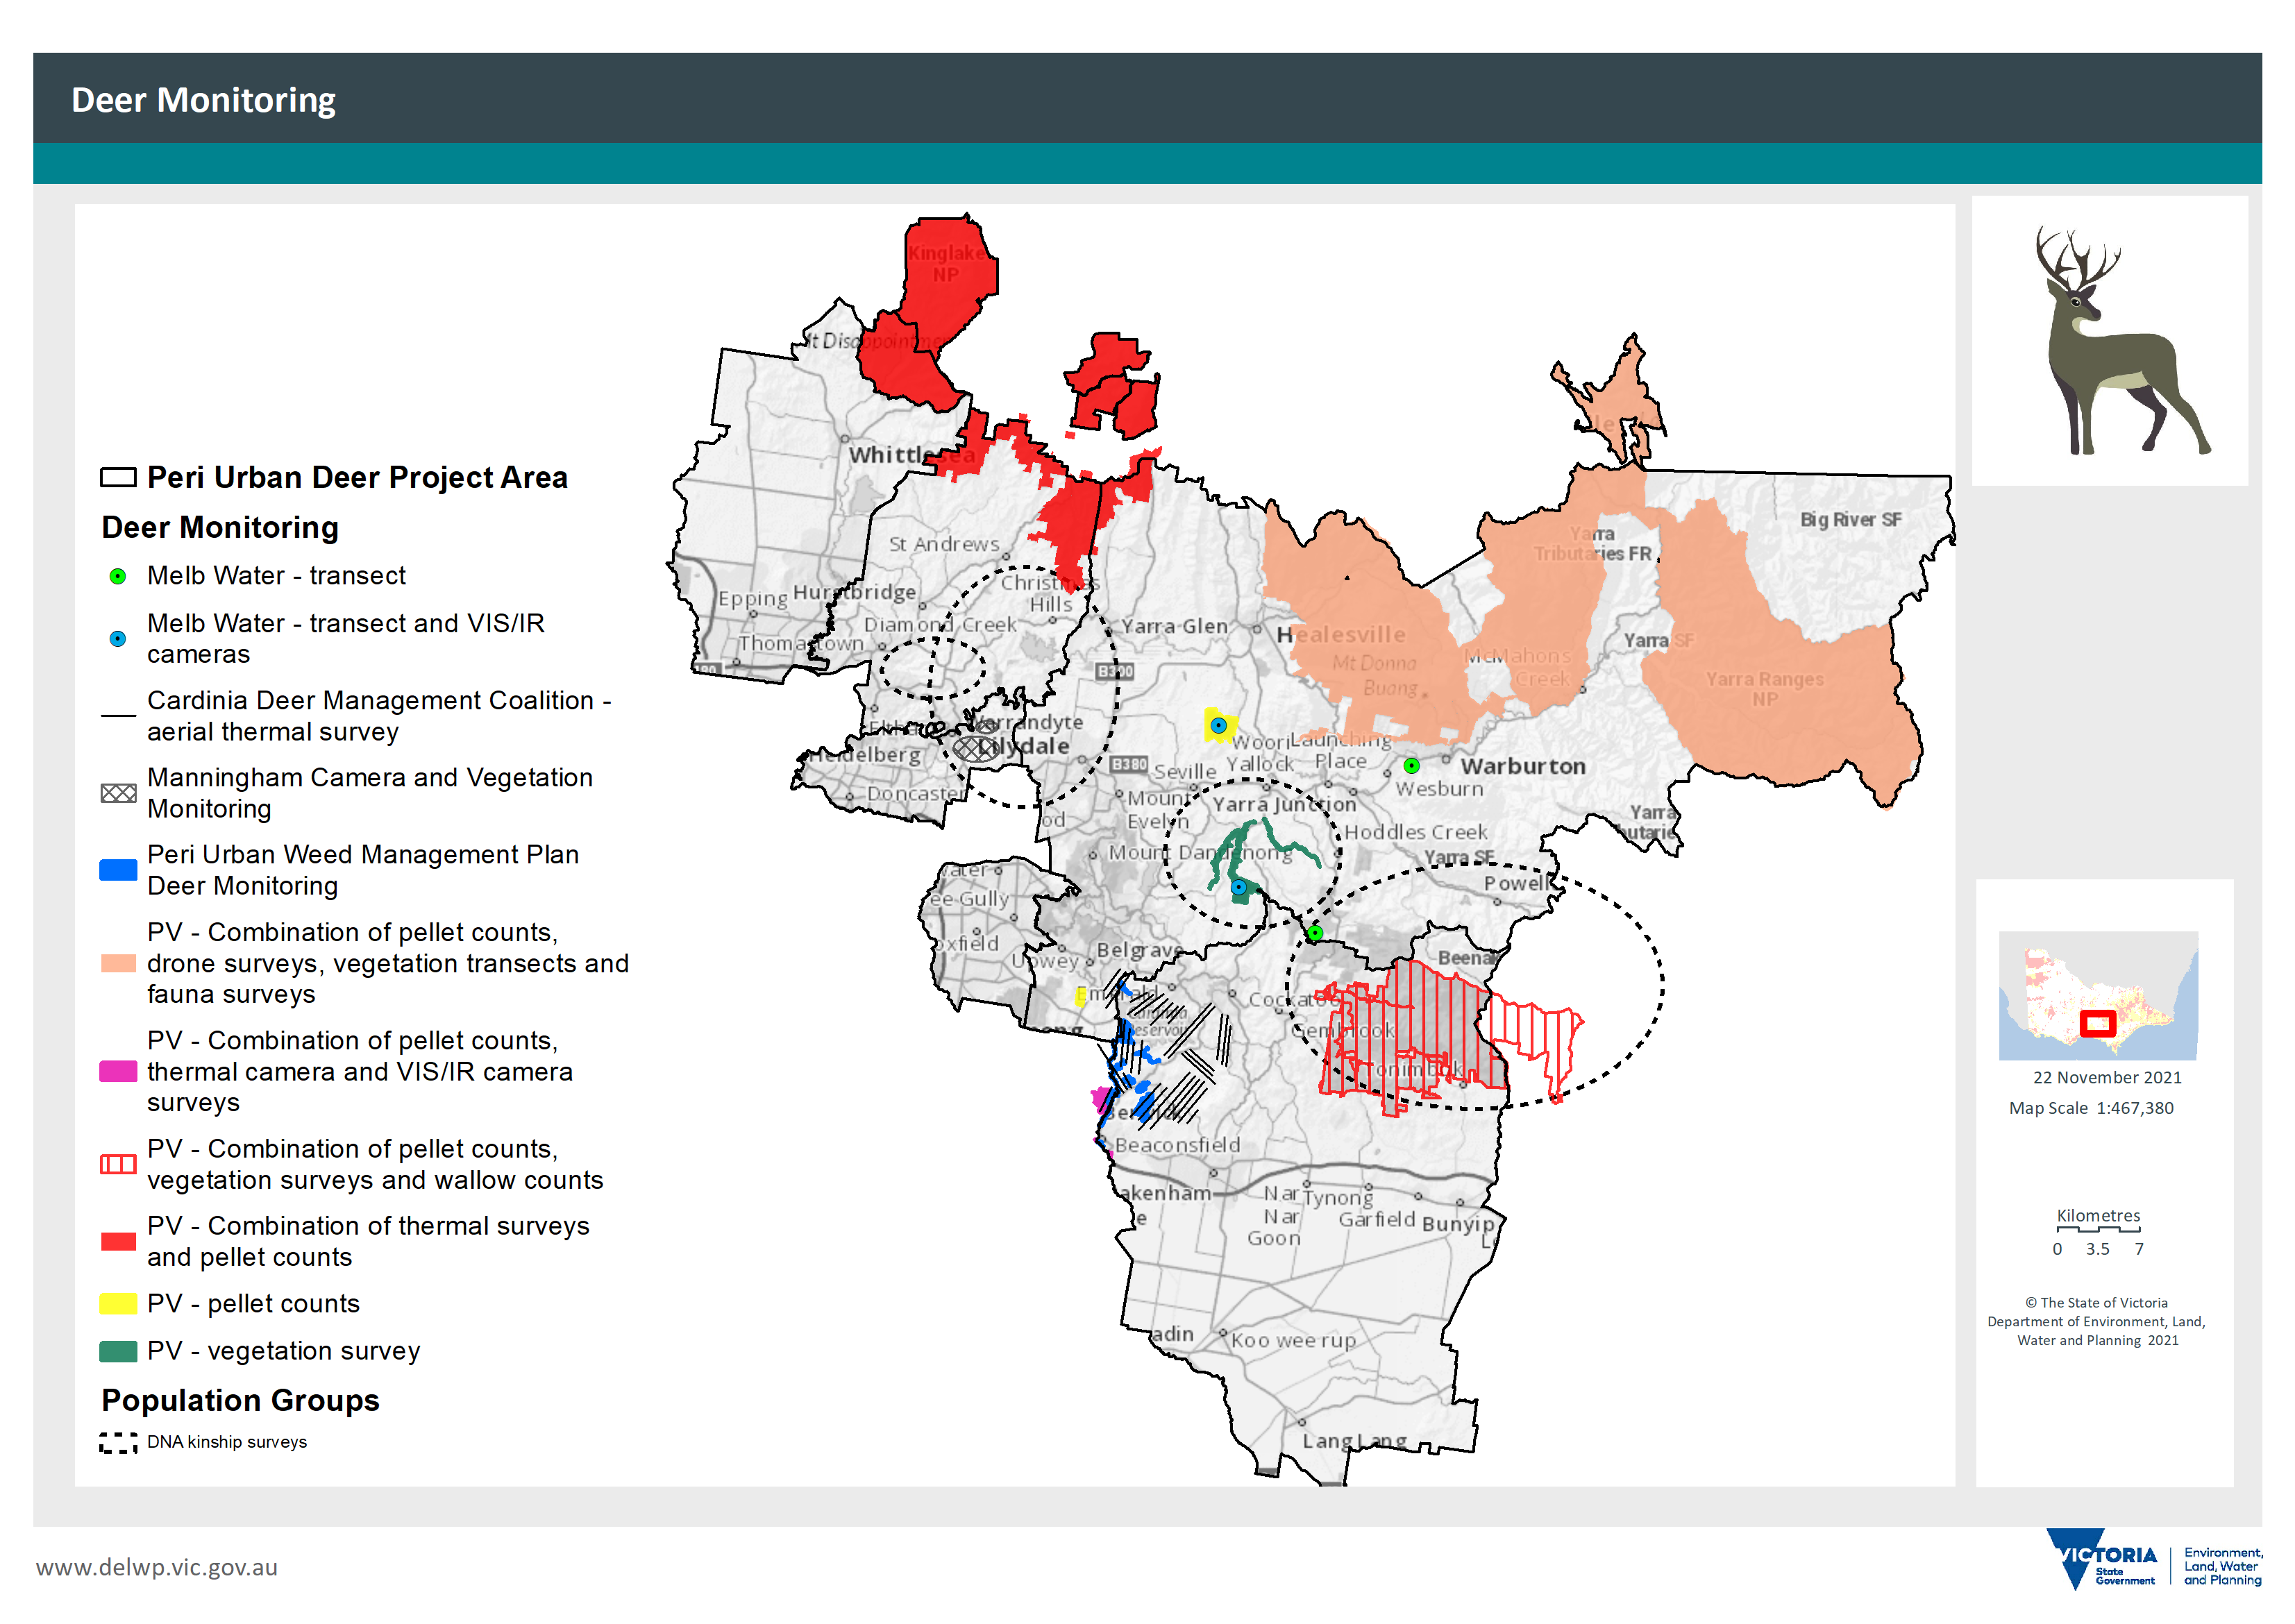
Figure 24: Deer monitoring
Location of threatened and locally significant flora and fauna across the Peri-Urban area
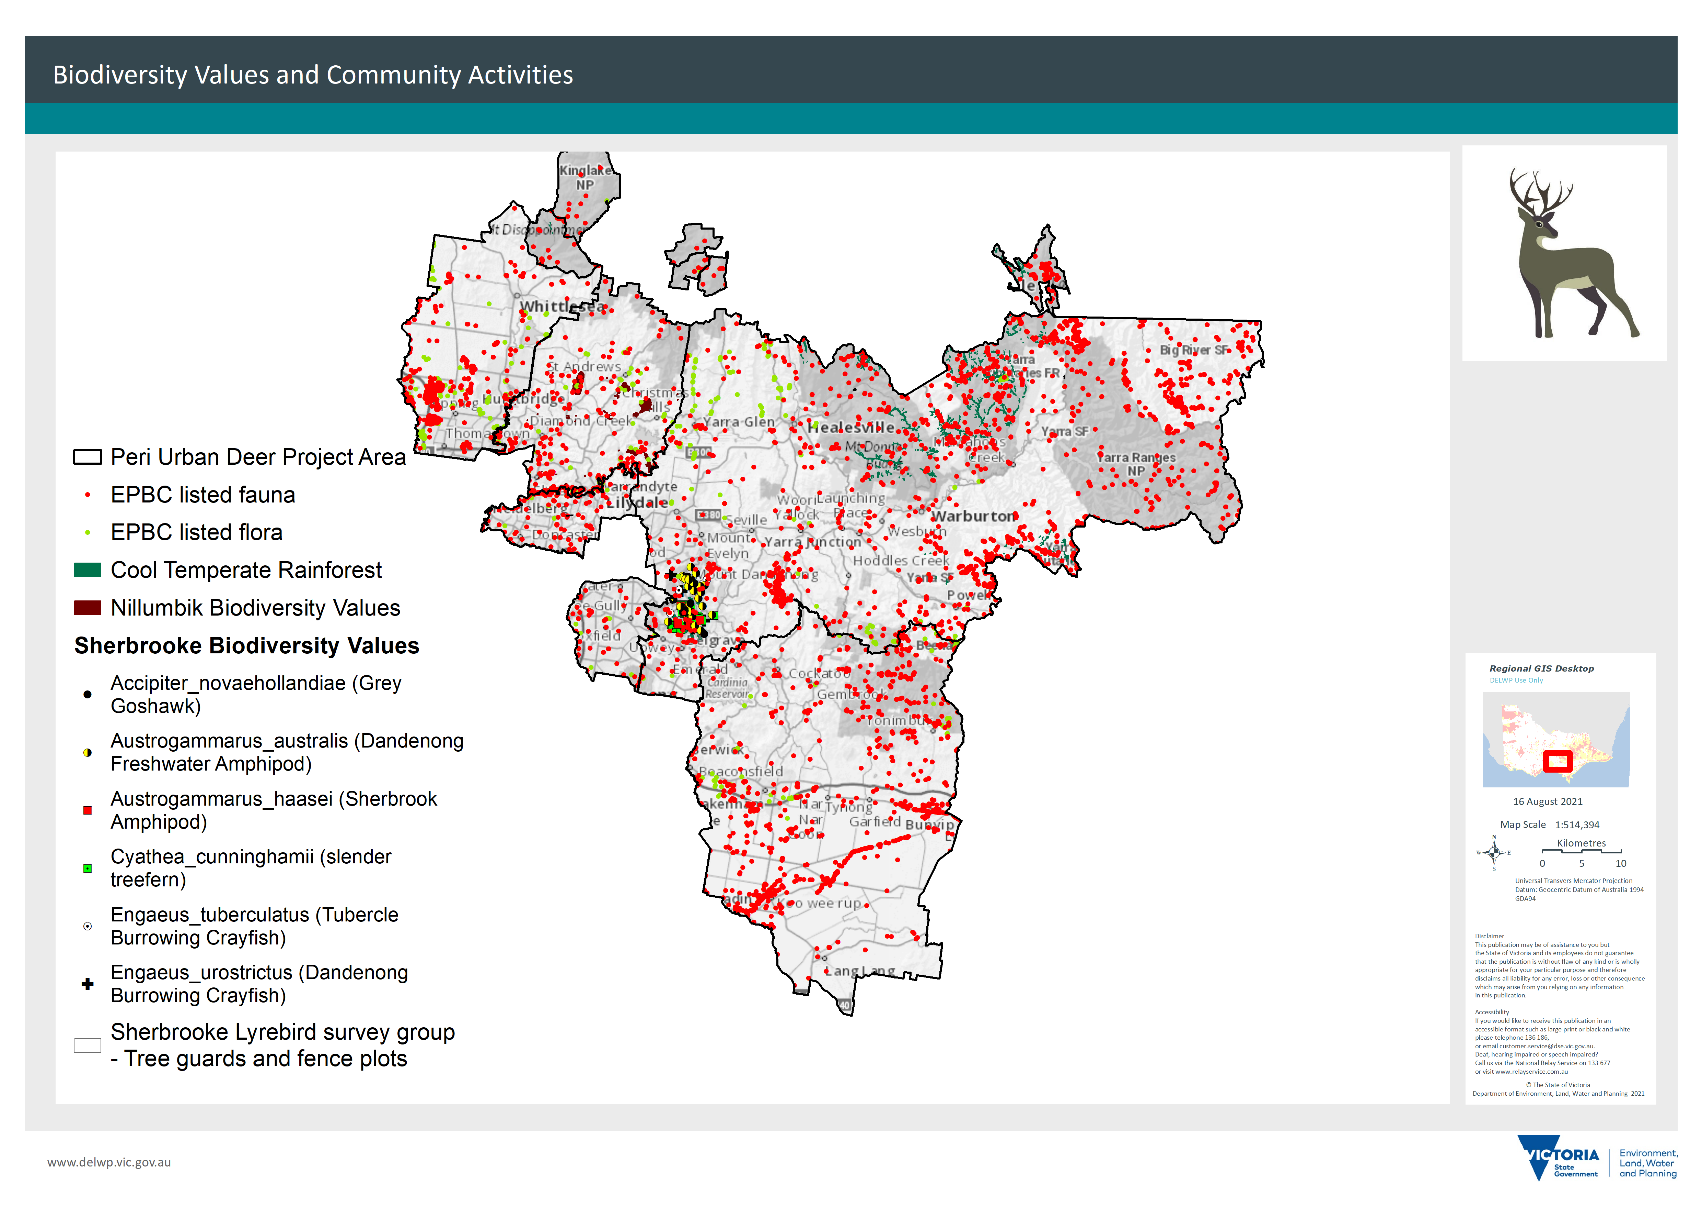
Figure 25: Threatened species and sites identified with species under threat from deer trampling in aquatic areas
Location of threatened Ecological Vegetation Classes (EVCs) at risk from deer in Kinglake National Park
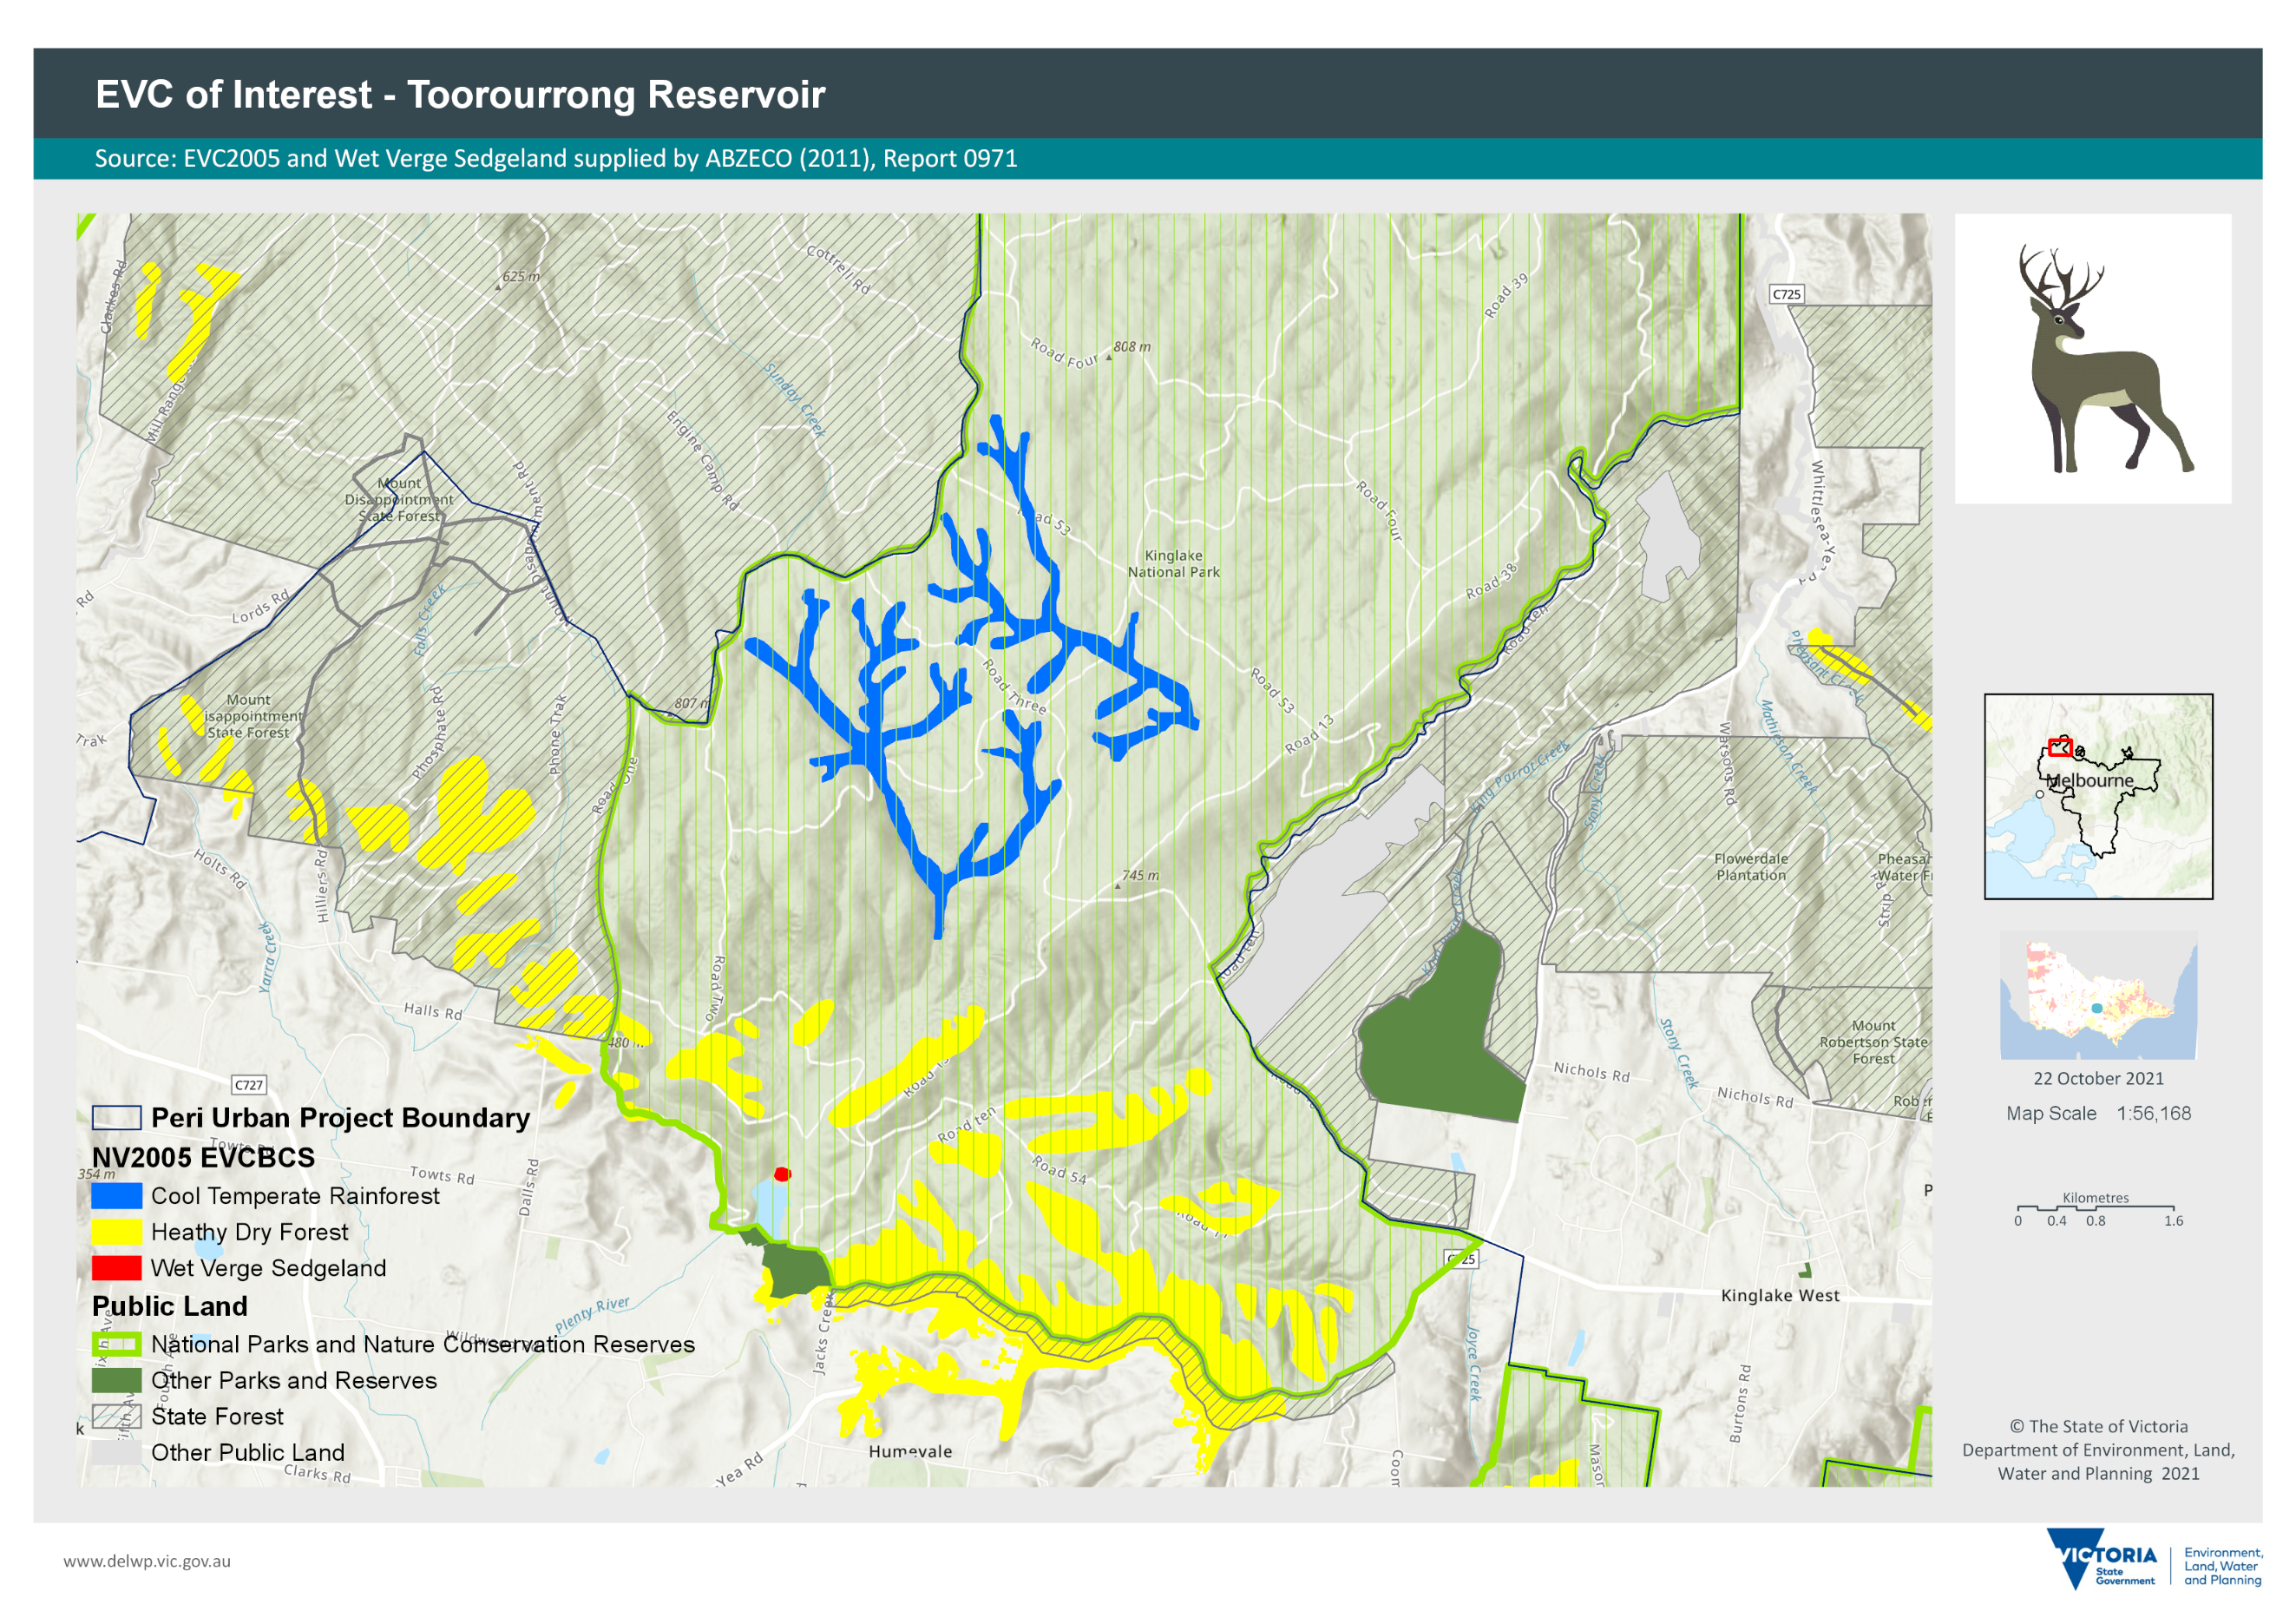
Figure 26: Sites of Ecological Vegetation Classes (EVCs) with distinct damage from deer in Kinglake National Park
Page last updated: 26/03/22