Monitoring tools
Monitoring can be done in different ways. Table 1 lists common monitoring tools available to assist in deer control work. These tools are described in more detail below. This is not an exhaustive list – other tools may exist beyond those described here.
Table 1: Frequently used monitoring tools
| Method | Usage |
|---|---|
Cameras | Indicate presence and density of deer, index of relative density/activity |
Vegetation monitoring | Impact and damage caused by deer |
Sampling of water | Indicates presence of deer using eDNA techniques |
Direct observation | Indicates presence or absence |
Radio tracking | Determines movement of deer as part of research |
Faecal pellet counts | Index of number and density of deer |
Aerial survey | Employing aircraft and drones to determine presence/density of deer and numbers of deer |
Genetic analysis (using deer tissue and scats) | Kinship/population structure, abundance estimates and connectivity |
Collision data - vehicles | Provide trends in deer encounters |
Notes about monitoring
Tracks of deer are easier to detect in the moist ground compared to dry conditions and are more readily observed along streams, water bodies, and game trails.
Deer often move around at night, so using thermal imaging and cameras can lead to better detection than daytime observation alone. Deer may roam over large areas and the frequency of encounters change with density. Deer are more likely to be found near water sources, particularly in dry environments.
Monitoring methods
Direct observation
The use of direct observations of deer alone may not provide accurate estimates of density, particularly if daytime sightings are used, because deer can often be hard to see. The initial establishment of deer at a site may go unnoticed until a population builds up.
Other techniques include spotlight, thermal, distance counts and vantage point counts.
There are opportunities to increase citizen science, collaborate with groups, schools, and other interested parties. These will contribute data towards improved strategic deer management. Further collaboration should improve data collection, storage and sharing. Community-led initiatives are being explored in parts of the Plan area.
Community members can improve deer data by logging deer sightings on the Victorian Biodiversity Atlas, Atlas of Living Australia, FeralScan or iNaturalist. We need accurate location data.
FeralScan is a free resource for landholders, Landcare groups, community groups, local councils, professional pest controllers and biosecurity groups. Deer sightings, damage and control results can be reported either directly on the FeralScan website or through the FeralScan pest mapping mobile app.
Camera
Camera trap monitoring is used to estimate the presence and/or total abundance and/or density of deer across the area of interest.
Using trail cameras to record deer presence often results in large amounts of image processing. Every photo needs to be checked for deer compared to other species. Artificial intelligence is being used to process photographs, but it is still an expensive process compared to manual image evaluation.
Site locations
Cameras should be located systematically (with a random start point) or randomly in available habitats. The total number of camera locations will depend on the size of the monitored area. The rule of thumb is that cameras should be at least 500m apart.
The coordinates of each monitoring site should be recorded using either geographical coordinates (i.e., Latitude/Longitude on GDA94) or projected (planar) coordinates). If coordinates are projected (i.e., Universal Transverse Mercator or UTM), record the projection used.
Field procedure at monitoring location:
- Navigate to the coordinates of the monitoring site (or as near as possible).
- Identify a suitable location to place the camera. Each location should have a clear Field of View (FOV) out to around 10 m. Locations should also be selected to minimise interference from the public.
- Place each camera on a suitable tree (or stake) approximately 1 m above the ground so that it has at least a 10 m FOV. Secure camera with a cable lock or similar. Clear away vegetation that may cause false triggering of the camera.
- Place four small stakes firmly in the ground using a hammer at 2.5, 5, 7.5 and 10 m from the camera along the centreline of the FOV. Ensure each stake is offset slightly, so each can be clearly seen in the camera (see below). Mark each stake with a band of reflective safety tape (available from major hardware stores). This will ensure good camera visibility at night. Figure 1 depicts day and night shots using cameras.
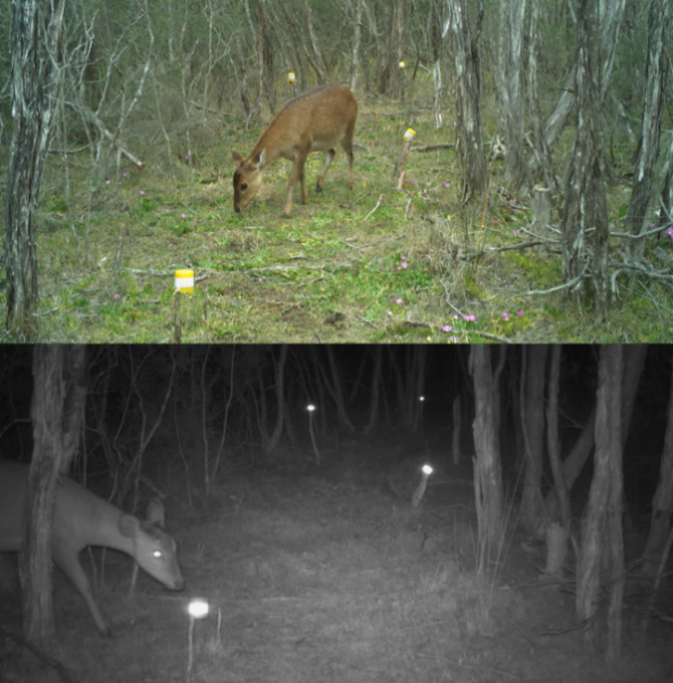
Figure 1: Daytime photo (top) and night photo (bottom) of deer
Vegetation monitoring
Vegetation monitoring is used to measure vegetation and ground layer attributes responses. Vegetation metrics include (but are not limited to):
- woody species presence
- abundance and recruitment
- vegetation community condition
- ground-layer cover (i.e., bare ground, litter, soil crust disturbance), and
- disturbance indicators such as browsing and damage by deer.
Recovery of areas after reduction or removal of deer is important to record. Quantitative and qualitative measures for vegetation are important. Qualitative floristic measures document the actual species comprising a community rather than its physical structure. The simplest floristic description of a vegetation type is simply a list of the species present. Often the species list is accompanied by a measure of the abundance of each species.
Measures of abundance include:
If damage is observed on adjacent land (such as an orchard), record the date of existing damage and subsequent impacts: for example, 25 trees stripped.
Catch-per-unit-effort
Shooting should record the number of hours of effort and animals shot. Also, record animals seen but not shot.
Records should include deer species, gender, and approximate age. If a tissue sample was taken, record the sample number and date taken. If possible, a tracklog of areas worked in an area can provide information for analysis.
Water sampling
Water sampling can help with monitoring the presence and type of deer. Where limited numbers of animals may be present, combining multiple water samples may be applied. The eDNA techniques are best conducted with a robust project design. Seek specialist advice.
Faecal pellet counts
Deer dropping pellet counts are used in some locations to determine deer densities. There is some opportunity for community involvement in scat collection.
In some studies, modelling is used to project where higher levels of deer are expected. Melbourne Water is using pellet counts on land they manage.
- Deer population estimates in fenced catchments – especially Cardinia and Silvan – to determine the current population, set cull targets and validate eradication.
- Deer faecal pellet density estimates on open grassy flats near the Upper Yarra Reservoir to measure the effectiveness of strategic ground shooting to reduce the quantity of faecal pellets. The shooting program can then be adjusted to achieve an acceptable density of faecal pellets.
- Deer faecal pellet density estimates and deer population density indices in priority areas of the upper catchments, next to reservoirs and weirs where information is lacking. This will provide two key details: an assessment of the microbial risk to water supply, and an index of deer abundance compared to other sites and catchments.
Aerial survey
Aircraft and drones can survey specific areas for the presence and density of deer.
Usually, thermal imagery allows the presence of animals to be determined and classified to estimate deer numbers at the time of the survey. This can help with planning activity such as on-ground control actions. In the Cardinia Local Government Area, a recent activity counted 158 deer using thermal imagery. Deer density is more important than the overall number of deer.
Genetic analysis
Collecting tissue from shot animals can contribute to genetic or DNA analysis of populations to help identify population connectivity.
Ongoing work at ARI in collaboration with La Trobe University suggests that distinct populations of deer may exist (unpublished).
The distinct populations for Melbourne are shown by different coloured circles, as shown in Figure 2.
This information allows the identification of changes in population boundaries and dispersal dynamics.
Methodology specific to this technique is available from a range of sources and is not intended to repeat that in this document.
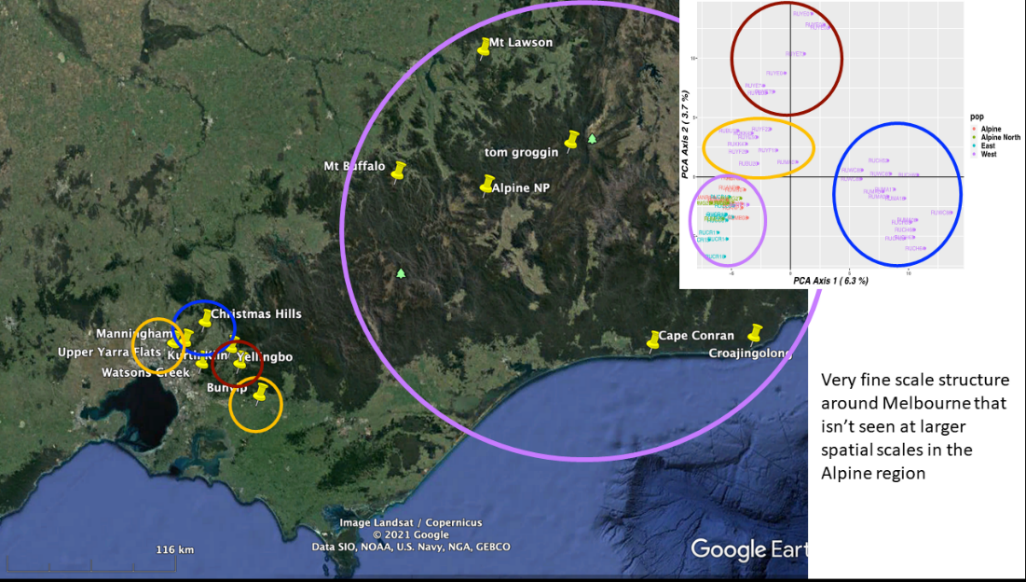
Figure 2: Population groups of Deer in eastern suburbs of Melbourne to Tonimbuk and eastern Victoria
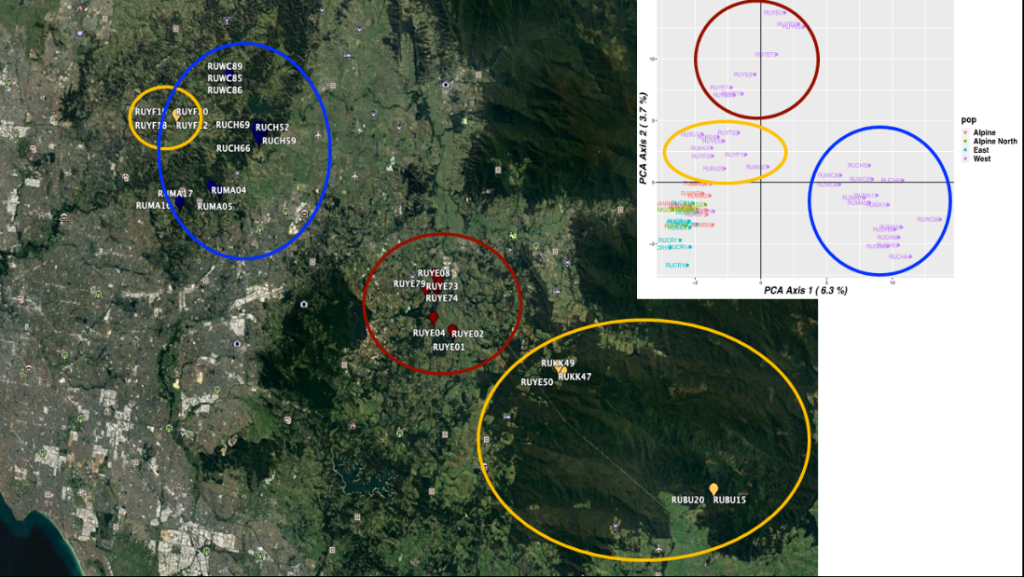
Figure 3: Population groups of Deer in eastern suburbs of Melbourne to Tonimbuk
Collision data
Collision data on vehicle accidents with deer can be used to measure the frequency of deer in an area. There is a reported rise in the number of deer hit by vehicles across Victoria. (Davies et al. 2020).
References
Davies, C, Wright, W, Hogan, F, Visintin, C (2020) ‘Predicting deer-vehicle collision risk across Victoria, Australia’, Australian Mammalogy, Vol 42(3):293–301.
Page last updated: 11/08/23